9 Rapid visualization and quantification of phagocytosis in neutrophils
This methods article was published in Neutrophils: Methods and Protocols and can be found here: DOI: https://doi.org/10.1007/978-1-0716-0154-9_11
9.1 Abstract
Phagocytosis by phagocytes such as neutrophils is a crucial part of the host innate immune response against invading pathogens. Phagocytosis is a complex process that initiates with the binding of the particles on the cell surface of the phagocytes through the interaction of pattern recognition receptors with ligands on the surface of the pathogens. During this process, phagocytes undergo extensive membrane reorganization and cytoskeleton rearrangement at their cell surface. To gain better insight about the molecular mechanisms of this dynamic cellular process, visualization and quantification in a high-throughput manner is essential. Here, we describe a microscope-based method to visualize and quantify phagocytic uptake of pathogens (such as bacteria and fungi) and model particulates that are larger than 0.5 μm (such as Zymosan A and IgG-coated beads).
9.2 Key words
Neutrophils, phagocytosis, fluorescence microscopy, high-throughput, phenotypic analysis
9.3 Introduction
Neutrophils represent a first line of defense when the body encounters a pathogen. These cells are capable of rapid chemotaxis to sites of bodily damage – they are some of the fastest cells in the mammalian body, and are commonly referred to as “the first responders” upon the initiation of an inflammatory signal1,2. Once at an inflamed site, neutrophils are highly versatile in their anti-pathogenic response: they produce cytokines to induce a hostile environment for invading pathogens, they play roles in the activation and direction of the adaptive immune response, they modulate inflammation, and they directly act with potent microbicidal effect1–5. Understanding the mechanisms through which neutrophils respond to pathogenic invasion can give insight into how an infection is resolved – and understanding these mechanisms may allow for the implementation of therapeutic tools to enhance or direct the neutrophil response.
Of particular importance, neutrophils wield phagocytosis to destroy would-be pathogens, as well as effete cells and debris6. Phagocytosis is a form of receptor-mediated cellular uptake that allows a cell to ingest particles greater than 0.5 μm in size7. This cellular process has been well studied, but there remain open questions regarding the mechanisms and signaling events that drive the dramatic changes in membrane reorganization, cell morphology, cytoskeleton remodeling, and membrane lipid composition that must ensue for the complete ingestion of a pathogen or particulate. A host of techniques allow for the assessment of phagocytic capacity, but many are limited to gross overviews of internalization (e.g., antibiotic protection assays) or lack the speed necessary for high-throughput phenotypic screens.
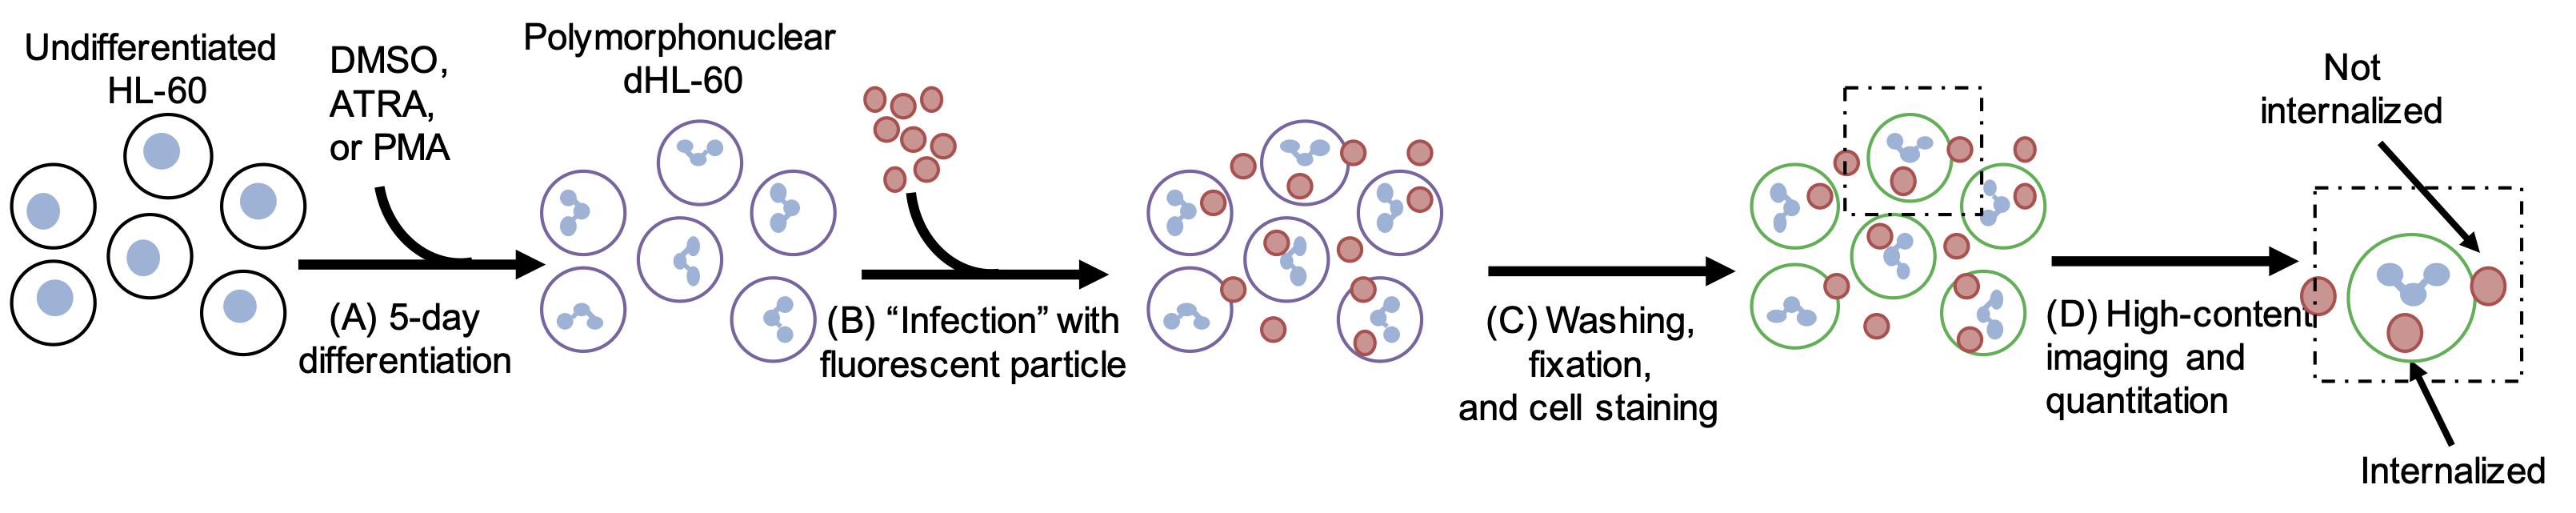
Here, we present a methodology for rapidly visualizing and quantifying the phagocytic capacity of neutrophils using high-content imaging microscopy (Figure 9.1). As the HL-60 neutrophil-like cell line is a classical staple of neutrophil study2,8,9, we focus on this line herein—however, these techniques are equally applicable to the study of primary neutrophils isolated from mouse or human peripheral blood . Similarly, any number of fluorophore-conjugated model particle or fluorescent reporter strain of pathogenic microbe may be used under this paradigm10,11. Through the use of fluorescent phagocytic particles and a cell membrane stain, one may rapidly acquire visual data sufficient to calculate the rate of phagocytic uptake of many hundreds or thousands of cells across experimental conditions. Combining a well-plate format and automated, high-content image acquisition, this technique allows for high-throughput phenotypic analysis following genetic or chemical screens.
9.4 Materials
HL-60 peripheral blood promyeloblasts (ATCC) (Footnote 9.6.1).
Growth medium: RPMI 1640 supplemented with 10% fetal calf serum, nonessential amino acids, and optional antibiotics/antimycotics.
Phosphate-buffered saline (PBS).
Differentiation medium: Growth medium supplemented with 1.2% DMSO (v/v)(Footnote 9.6.1).
Imaging surface:
- Option 1: Senso Microplate glass-bottom 96-well plate (Greiner Bio-One).
- Option 2: Microscope coverslips(1.2 cm diameter) and standard 24-well plate.
20× poly-L-lysine coating solution: 50 mg poly-L-lysine in 50 mL diH2O, filter through a 0.22 μm filter. Dilute in H2O for a 1× working stock.
Model phagocytic particle (Footnote 9.6.2):
- Option 1: Zymosan A (S. cerevisiae) Bioparticles™ Alexa Fluor™ conjugate (Thermo Fisher Scientific; multiple fluorescence choices).
- Option 2: Fluoro-Max™ Fluorescent Carboxylate-Modified Particles (Thermo Fisher Scientific).
- Option 3: Mycobacterium tuberculosis H37Rv (ATCC 25618) expressing mCherry reporter (or another fluorescent reporter microbe).
4% paraformaldehyde solution
Permeabilization/blocking buffer: 1% bovine serum albumin (w/v) and 0.1% Triton-X100 (v/v) in PBS.
Cell surface stain (Footnote 9.6.3): Phalloidin Alexa Fluor™ (e.g., Thermo Fisher Scientific; multiple fluorescence options) in permeabilization/blocking buffer at approximately 1:50 dilution (titration may be necessary).
Nuclear stain (Footnote 9.6.3): DAPI (4′,6-diamidino-2-phenylindole) in PBS at approximately 1μg/mL (titration may be necessary).
9.5 Methods
9.5.1 Differentiation of HL-60 Cells into Granulocytic Neutrophils
Grow HL-60 cells in growth media using standard tissue culture techniques. When cultured cells reach a density of approximately 1 × 10⁶ cells/mL, replace growth media with an equal volume of differentiation media (Footnote 9.6.1).
Incubate cells at 37 °C and 5% CO2 for at least 5 days to obtain fully differentiated HL-60 (dHL-60) cells (Footnote 9.6.4).
9.5.2 Immobilization of dHL-60 Cells to Glass-Bottom Plate or Coverslip
Coat desired imaging surface (96-well plate, coverslips, etc.) according to steps below (Footnote 9.6.5)12.
Add 1× polylysine solution to sterile multi-well plates or coverslips and incubate at 37 °C for 1 h.
Aspirate polylysine solution and leave to dry. Plates and coverslips may be kept at 4 °C.
From cultured dHL-60 cells, isolate an appropriate number of cells to your preferred imaging surfaces (Footnote 9.6.6, Footnote 9.6.7).
Resuspend cells in the minimum volume to cover surface of the well (approximately 50 μL for 96-well and 250 μL for 24-well plate), and add cells to the appropriate wells.
Centrifuge cells in plate for 5 min at 250 × g, and allow the cells to recover in differentiation media at 37 °C and 5% CO2 for at least 1 h (or overnight) to maximize immobilization.
9.5.3 Phagocytosis of Phagocytic Particles by dHL-60
Isolate an appropriate number of phagocytic particles for a multiplicity of infection (MOI) of approximately ten particles per cell.
Resuspend in growth medium or PBS at the minimum volume to cover the surface of the well (approximately 50 μL or 250 μL for 96- and 24-well respectively).
Particle solution may be sonicated for 5–10 min in a water bath or passed through a narrow-gauge syringe needle 10–20 times to reach a single-particle suspension.
Aspirate growth media from cells affixed to well-plate, wash gently with PBS, and add resuspended particle solution to the cells. Centrifuge plate for 1 min at 250 × g to sediment the particles to the bottom of the well.
Incubate cells and particles at 37 °C and 5% CO2 for 10 min (Footnote 9.6.8).
Gently wash cells twice with PBS to remove unbound particles.
Fix cells using ice-cold 4% paraformaldehyde solution for 30 min on ice. After fixation, remove formaldehyde solution and hydrate wells with PBS. Plate may be stored at 4 °C for up to a week after fixation, although it is recommended to proceed with staining as early as possible.
9.5.4 Fluorescent Cell Staining
If using phalloidin (Footnote 9.6.3): aspirate PBS, and treat cells for 15 min with permeabilization/blocking buffer.
Remove permeabilization/blocking buffer, add cell surface stain, and incubate for approximately 1 h at room temperature under cover from light (Footnote 9.6.9).
Remove cell surface stain solution and wash twice with PBS.
Stain nuclear DNA using nuclear staining solution for 10 min at room temperature under cover from light (Footnote 9.6.3).
Remove nuclear staining solution and wash twice with PBS. Leave cells in PBS under cover from light until imaging is completed.
If using a 96-well plate, imaging may be performed with no further preparation. If using glass coverslips, follow the steps below to mount the slips to microscopy slides.
On clean microscopy slide, pipette a single droplet (~15 μL) of anti-fade mounting medium and carefully place coverslip cell-side down on top of this droplet, taking care to minimize air bubbles.
It is recommended to use a lacquer to glue down the coverslips and prevent drying. Standard clear nail polish is a sufficient affixation agent.
Allow lacquer to fully dry before imaging .
9.5.5 Image Acquisition
Regardless of acquisition setup (Footnote 9.6.10), optimize parameters for excitation and exposure times for the respective fluorophores used in the experimental workflow.
We recommend image collection at 10× or 20× magnification to maximize the total number of cells captured per image. It is best to capture at least 500 cells across the majority of the well or coverslip per technical replicate per experimental condition.
For optimal quantification, images should be collected in a plane such that the nucleus, cell boundary, and any internalized beads are all clearly distinguishable across the relevant channels with minimal background and inter-channel fluorescence.
9.5.6 Image Analysis (Quantification)
To analyze images, identify the total number of cells captured per image and the number of fluorescent particles fully internalized (Footnote 9.6.11).
If using a manual counting method, count the number of nuclei cells and internalized beads per image.
If using an automated or semiautomated counting method, define threshold parameters for each fluorescent channel, and apply the same parameters for every experimental condition within a biological replicate.
Calculate rate of phagocytic uptake by aggregating the total number of internalized particles and dividing by the total number of isolated cells for every technical replicate across every experimental condition. Technical replicates may be aggregated to report a single uptake rate for every biological replicate.
Normalization between biological replicates may be necessary to compensate for inter-experimental variability.
Uptake rates may be reported as box- or dot-plots and differences between experimental condition may be assessed using a two-tailed, unpaired Student’s T-test.
Alternatively, one may depict uptake rate using a histogram or violin-plot to represent the number of beads internalized per cell in order to visualize the distribution of uptake events across experimental conditions.
Differences between experimental conditions may be assessed using a discrete nonparametric test, such as the Chi-squared test or the Kolmogorov–Smirnov Test.
9.6 Footnotes
9.6.1 Footnote 1
HL-60 cells are derived from peripheral blood leukocytes isolated from a patient with acute promyelocytic leukemia, and can be differentiated into granulocytic neutrophil-like cells using 5-day treatments with DMSO, all trans-retinoic acid (ATRA), or phorbol 12-myristate 13-acetate (PMA)2,8,13,14. It is advisable to titrate concentrations of activating agent to identify the optimal differentiation conditions in one’s own laboratory. Spontaneous, non-granulocytic differentiation can occur in the absence of activating reagents, and it is recommended to limit passage number to avoid spurious differentiation8.
9.6.2 Footnote 2
One may select from a range of model phagocytic particles. This methodology requires only that the selected model particle is fluorophore-conjugated/labeled. Common models include: Zymosan A (which consists of a fungal glycan that acts as ligand to the pathogen recognition receptor Dectin-1), opsonized and non-opsonized silica beads (which act as ligands for FCγR and CR3, respectively), and live or heat-inactivated fluorescent reporter strains of bacteria such as Salmonella enterica Serovar Typhimurium or Mycobacterium tuberculosis (which are both decorated with ligands for a host of pathogen recognition receptors)15,16.
9.6.3 Footnote 3
It is necessary to select cellular and nuclear stains with compatibility with the fluorescently labeled model phagocytic particle. We recommend phalloidin, a fungus-derived toxin that effectively stains filamentous actin. Phalloidin may be purchased as a fluorophore-conjugated cell boundary marker in multiple ranges of excitation/emission.
9.6.4 Footnote 4
Differentiated HL-60 cells will remain in suspension, and previous reports suggest that dHL-60 cells will die through apoptosis beginning on day 8 of treatment13,14. If performing genetic or chemical screens, it is recommended that transfection/transduction or treatment begin during the 5-day differentiation period such that cells are prepared for phagocytosis analysis by day 5.
9.6.5 Footnote 5
Poly-L-lysine coating may be used to affix dHL-60 cells to imaging glassware. Such coated products are available for purchase (See Materials 9.4), or may be prepared in-house as described previously12.
9.6.6 Footnote 6
We recommend seeding approximately 2 × 10⁴ cells when using a 96-well glass-bottom imaging plate, and approximately 5 × 10⁴ cells when using 24 mm diameter coverslips in a standard 24-well plate.
9.6.7 Footnote 7
It is highly recommended to perform this uptake assay with multiple technical replicates, with differentiation and uptake assays performed on independent days for each biological replicate. Experimental conditions should be assayed in parallel for every biological replicate, as significant variation may occur between replicates.
9.6.8 Footnote 8
Exact uptake time may need to be optimized: 10 min may be too long if cells are highly activated, and one is characterizing a weak phenotype, or too short if the model phagocytic particle is taken up poorly. It is recommended to optimize this timing using a three- or four-point time course on wild-type cells.
9.6.9 Footnote 9
As with many staining protocols, it may be necessary to modulate both the concentration of staining reagent and the time to maximize signal and minimize background.
9.6.10 Footnote 10
Images for phagocytic analysis may be collected on a range of acquisition platforms—so long as the microscope has the excitation/detection capacities to capture the fluorophores used, it ought to be sufficient for this methodology. We recommend the KEYENCE BZ-X700 all-in-one fluorescence microscope (KEYENCE) due to its capacity for semiautomated image acquisition and multi-field image stitching.
9.6.11 Footnote 11
A number of image analysis software tools with compatible cell counting protocols are available, including CellProfiler (open access), FIJI (open access), Imaris (Oxford Instruments), and KEYENCE BZ-X Analyzer (KEYENCE). It is notable that a semiautomated cell counting tool is preferable to manual counting for enhanced throughput and reduced user bias.
9.7 Contributions
GG compiled the concepts and references reviewed and wrote this methods chapter. FGT provided text edits and oversaw the design of this methods chapter.