5 Living Off the Fat of the Cell
A lipidomics map of the Mycobacterium tuberculosis-infected cell
5.1 Abstract
For centuries, humans have been seeking reliable treatment for tuberculosis, but unfortunately, it still poses a significant threat to global health. Recent research has shown that host lipid biology may offer new opportunities for developing novel antitubercular therapy. Here, we identify unique signatures of Mycobacterium tuberculosis (Mtb) infection by comparing the global lipidome of cells infected with pathogenic and attenuated Mtb strains against the lipidomes of cells treated with isolated Mtb cell wall components. We find that pathogenic and attenuated infections and treatments with pathogen-associated molecular patterns induce significant upregulation of diacylglycerol production. However, only pathogenic infection increases the production of triacylglycerol and acylcarnitine, reflecting induced fatty acid β-oxidation, while inhibiting the synthesis of lysophospholipids and plasmalogens, which reflects concerted subversions of the macrophage antimicrobial program. This research shows great potential in identifying potential host-directed therapies.
5.2 Introduction
Mycobacterium tuberculosis (Mtb) is a pathogen with unique lipid needs from the host. To date, Mtb was responsible for over 1.3 million deaths in 2022 through active tuberculosis disease, and estimates suggest that up to 2 billion people harbor latent tuberculosis infection1. While frontline antibiotic therapy has a high success rate1, the threat of antibiotic-resistant strains is the source of remarkable concern – driving renewed interest in developing host-directed therapy (HDT) to reduce the permissivity of the human host in conjunction with frontline antibacterial therapy. We and others have suggested that unexplored lipid biology may hide novel avenues for anti-TB HDT2. Mtb induces massive changes to the host lipid profile, and previous work has sought to reveal lipid-based biosignatures of TB infection3. However, no study has sought to systematically disentangle the antimicrobial host response from the Machiavellian manipulations that an Mtb infection induces in the host cell. Further, none has attempted to map the effects of Mtb infection to individual components of the Mtb cell wall.
Mtb is uniquely adapted to human hosts and thus has become a highly subtle pathogen: nearly an obligate intracellular bacterium, it needs to acquire all its nutrients and energy from the host cell in its protracted siege within the lung4. In infecting alveolar macrophages and other antimicrobial immune cells, Mtb seeks to subvert the host immune response by limiting antigen presentation to the adaptive immune system and suppressing inflammatory cytokine release. To this end, Mtb wields a molecular arsenal comprising many factors that allow it to redirect phagosomal maturation and thus avoid degradation in the lysosome. Curiously, this bacterium is well-suited to utilize host lipids as a significant carbon/energy source, having devoted over a third of its genome to lipid transport, metabolism, and catalysis5–7. The accumulation of foamy macrophages within the granuloma is a well described phenomenon preceding progression from latent to active TB disease. These cells are replete with lipid droplets and primed for fatty acid oxidation instead of glycolysis. Prior reports have shown that Mtb can utilize lipids from lipid droplet-replete host cells, reportedly through cholesterol metabolism8, and that Mtb induces the recruitment of lipid droplets toward the Mtb-containing endosome. Intriguingly, conflicting reports describe both the pro-bacterial and pro-host effects that these foamy macrophage phenotypes have during the progression of an Mtb infection9–11. Notably, the alterations induced in a host cell by Mtb infection are the combined effects of Mtb’s pathogenic manipulations and the innate immune action of the cell. Throughout the infection, these influences will counterbalance each other to determine the winner in the tug-of-war between the host and the pathogen.
Layer et al.’s review on lipidomics techniques and advances discusses advances in lipidomics techniques and analysis tools. Among many challenges is an astounding diversity of solvent-extractable, apolar mycolic acids12. While numerous studies have utilized omics analyses to probe fundamental questions about the host-pathogen interactions during an Mtb infection, only one report has investigated the effects that infection has on the host lipidome13. Saquib et al. characterize profound ER changes, apoptosis inhibition, and induced cholesterol synthesis during pathogenic infection13. However, they do not attempt to map the Mtb components which induce such effects. Are they the product of active mycobacterial processes, or are these effects a component of the cellular response to infection?
In the present study, we aim to address these questions using untargeted lipidomics. We analyzed cells infected with pathogenic and attenuated strains of Mtb and compared their lipidomes with those of cells treated with five pathogenic Mtb components, including lipoarabinomannan, 1-tuberculosinyladenosine, phthiocerol dimycocerosate, phosphatidyl-myo-inositol dimannoside, and sulfolipid-1. We find several such signatures. Among these, pathogenic infection induces the up-regulation of triacylglycerol synthesis and acylcarnitine accumulation – likely indicators of upregulated fatty acid β-oxidation. We also find that pathogenic infection induces depletion of antimicrobial lysophospholipids and plasmalogens. Such findings are crucial steps in identifying routes of host-directed therapy.
5.3 Results
5.3.1 Global lipidomics reveals acute changes in the host lipidome during pathogenic Mycobacterium tuberculosis infection.
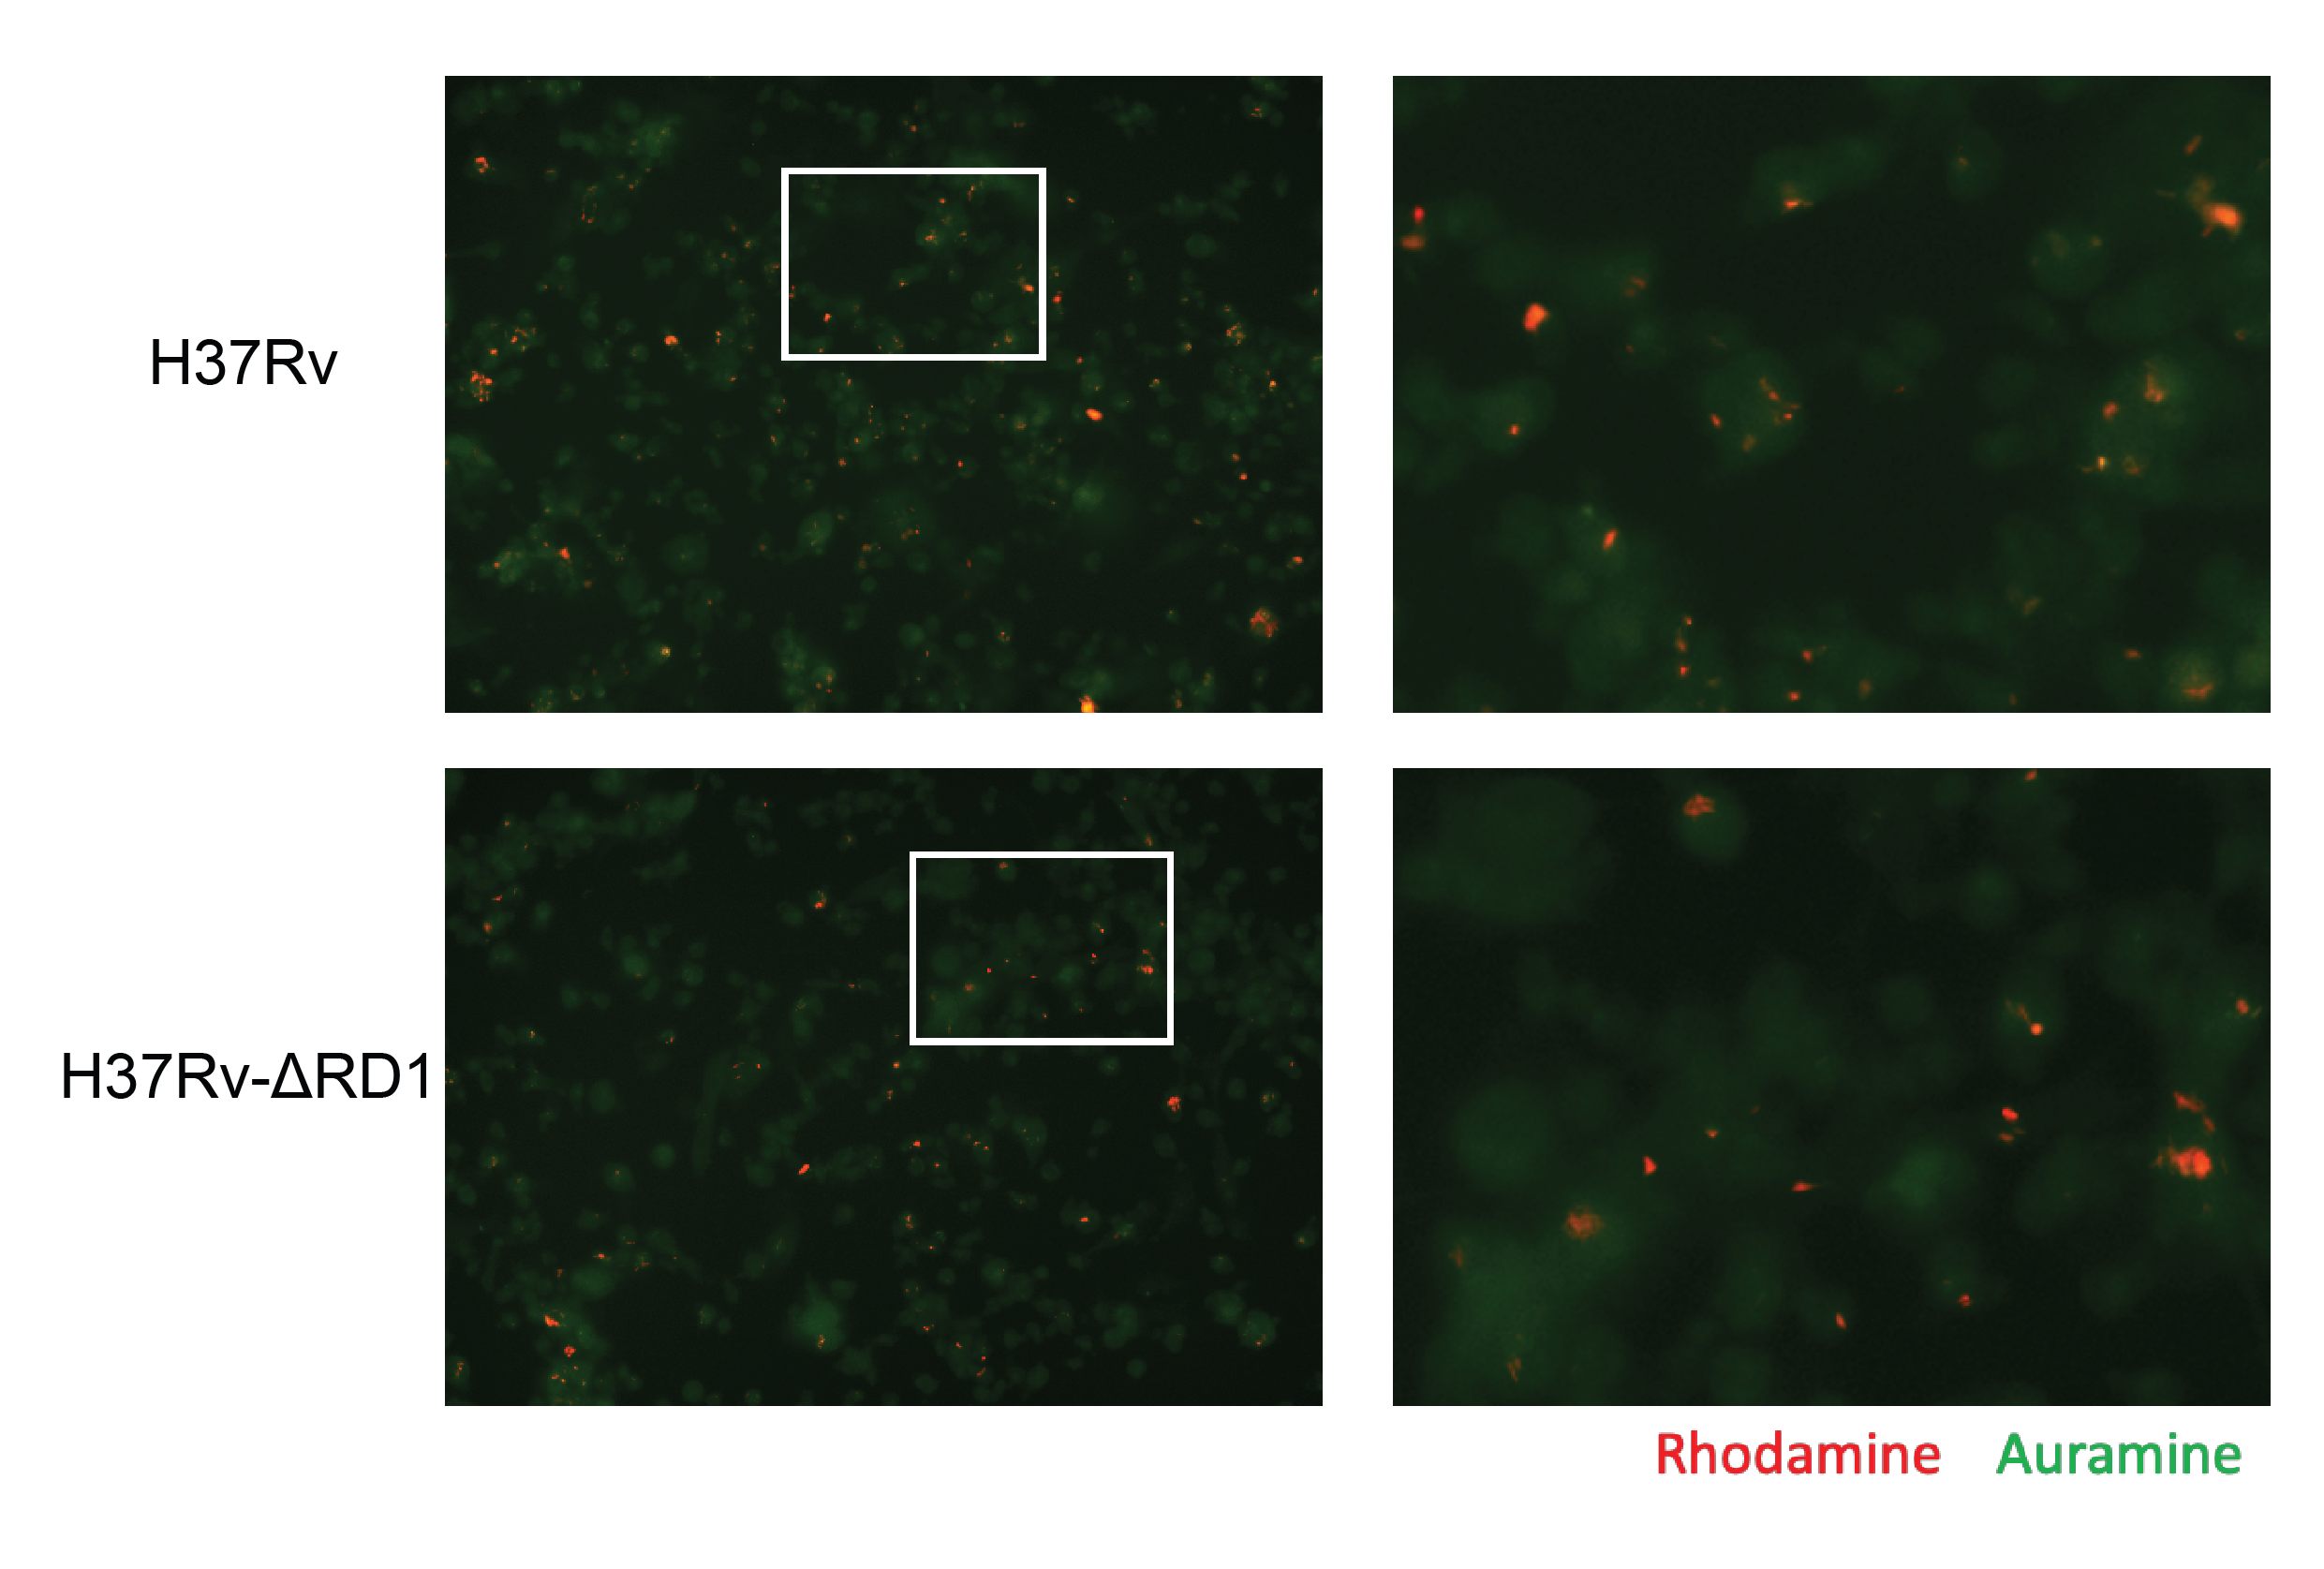
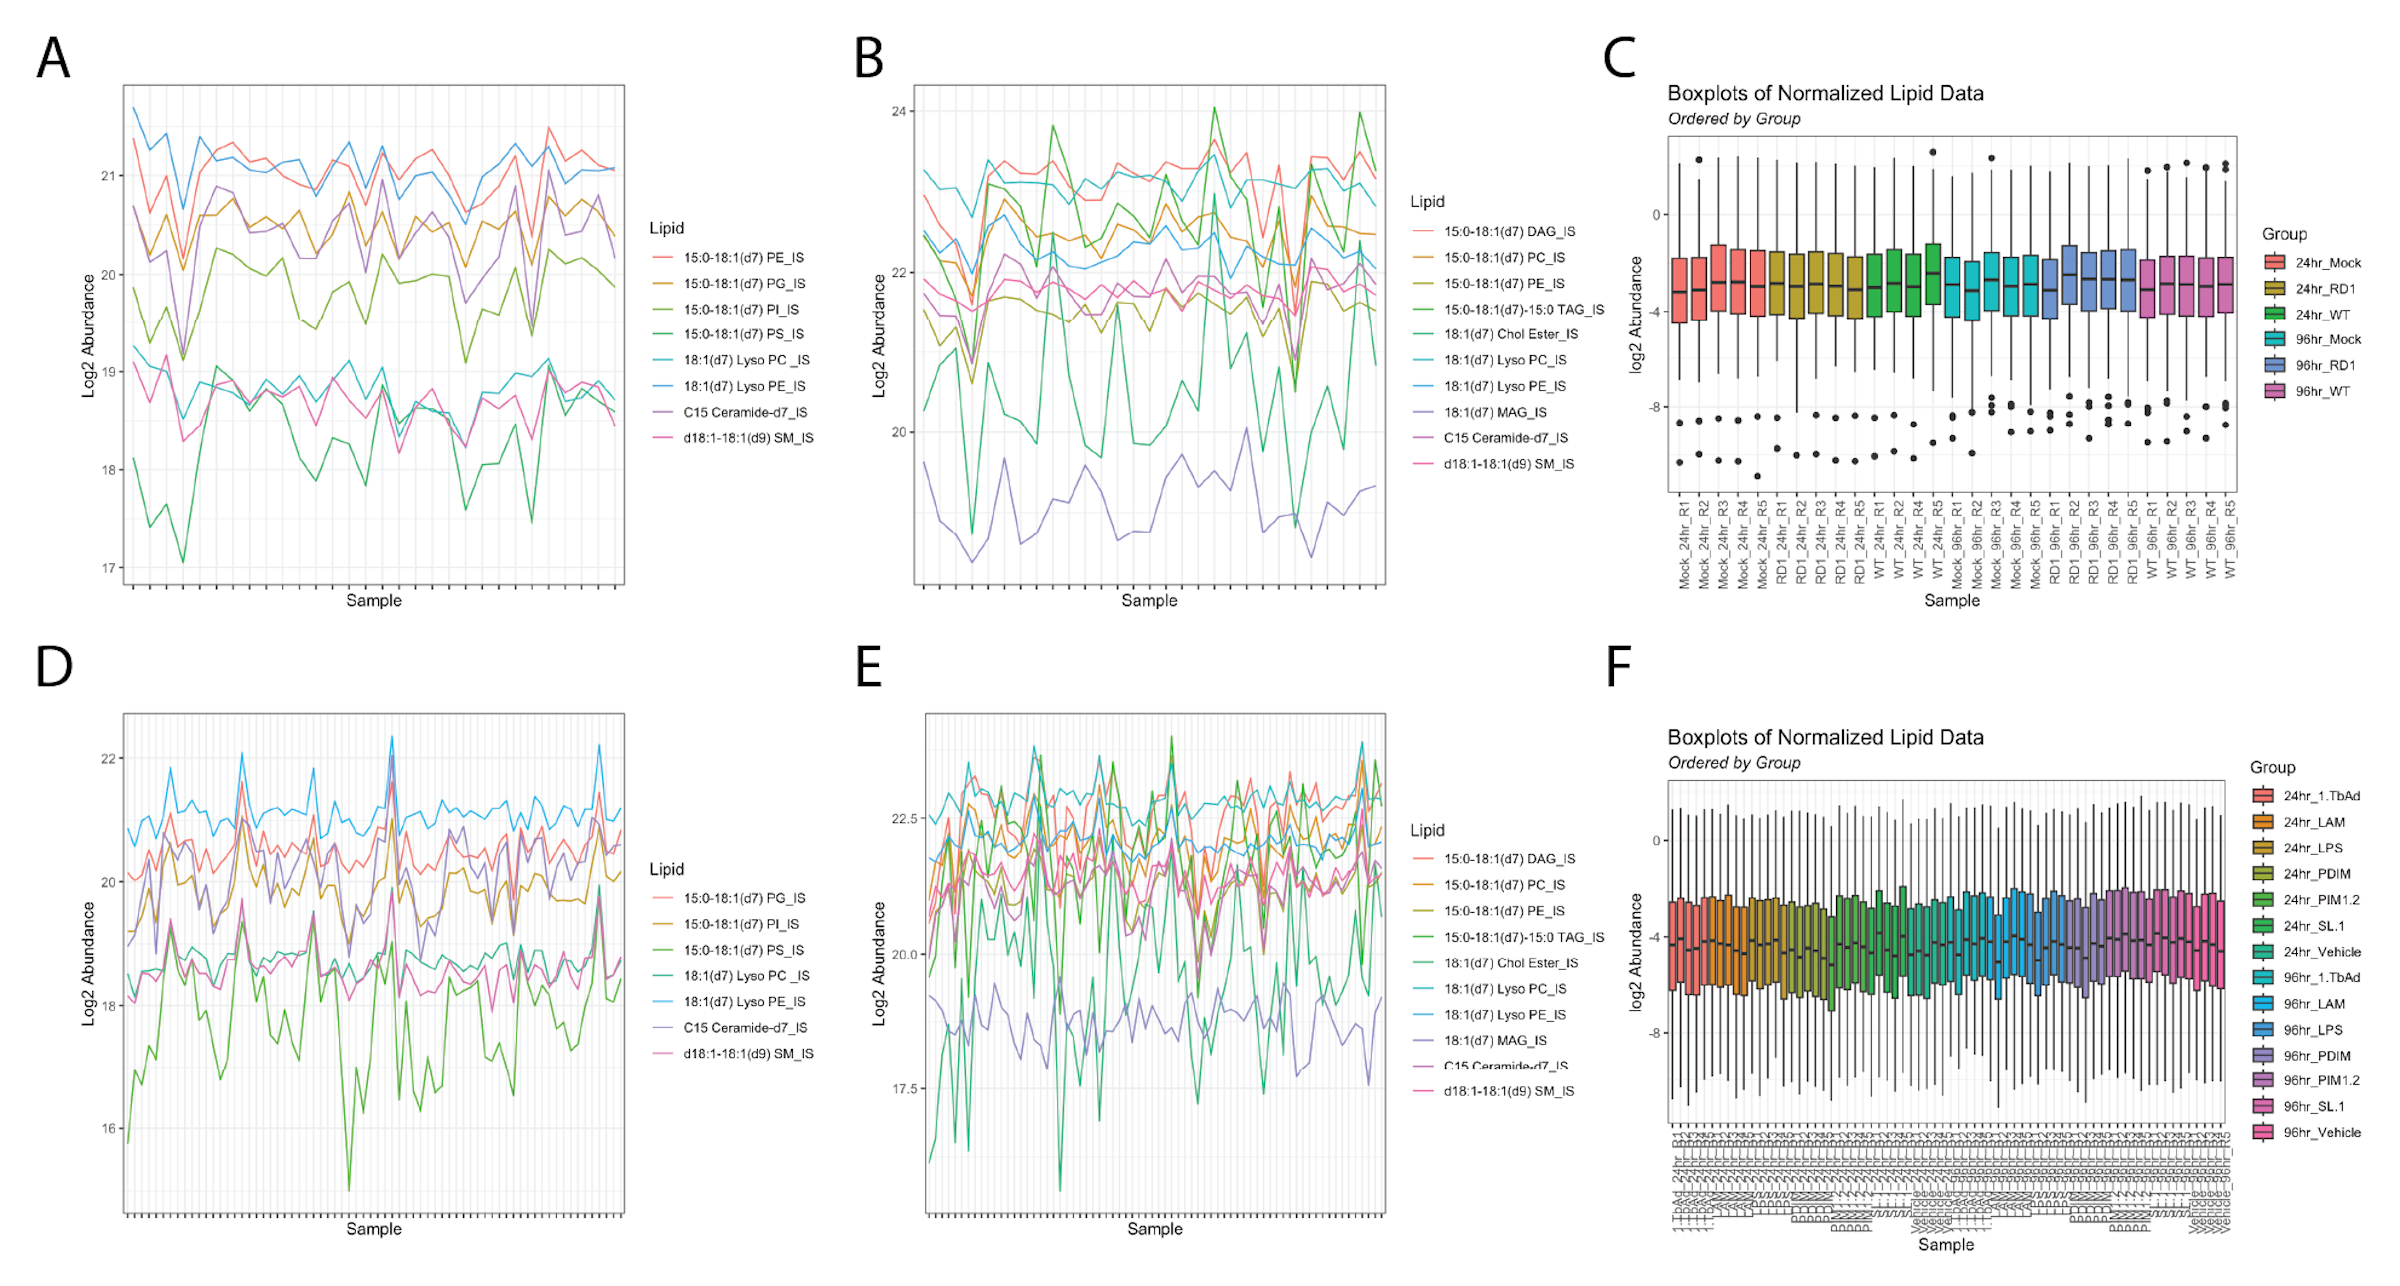
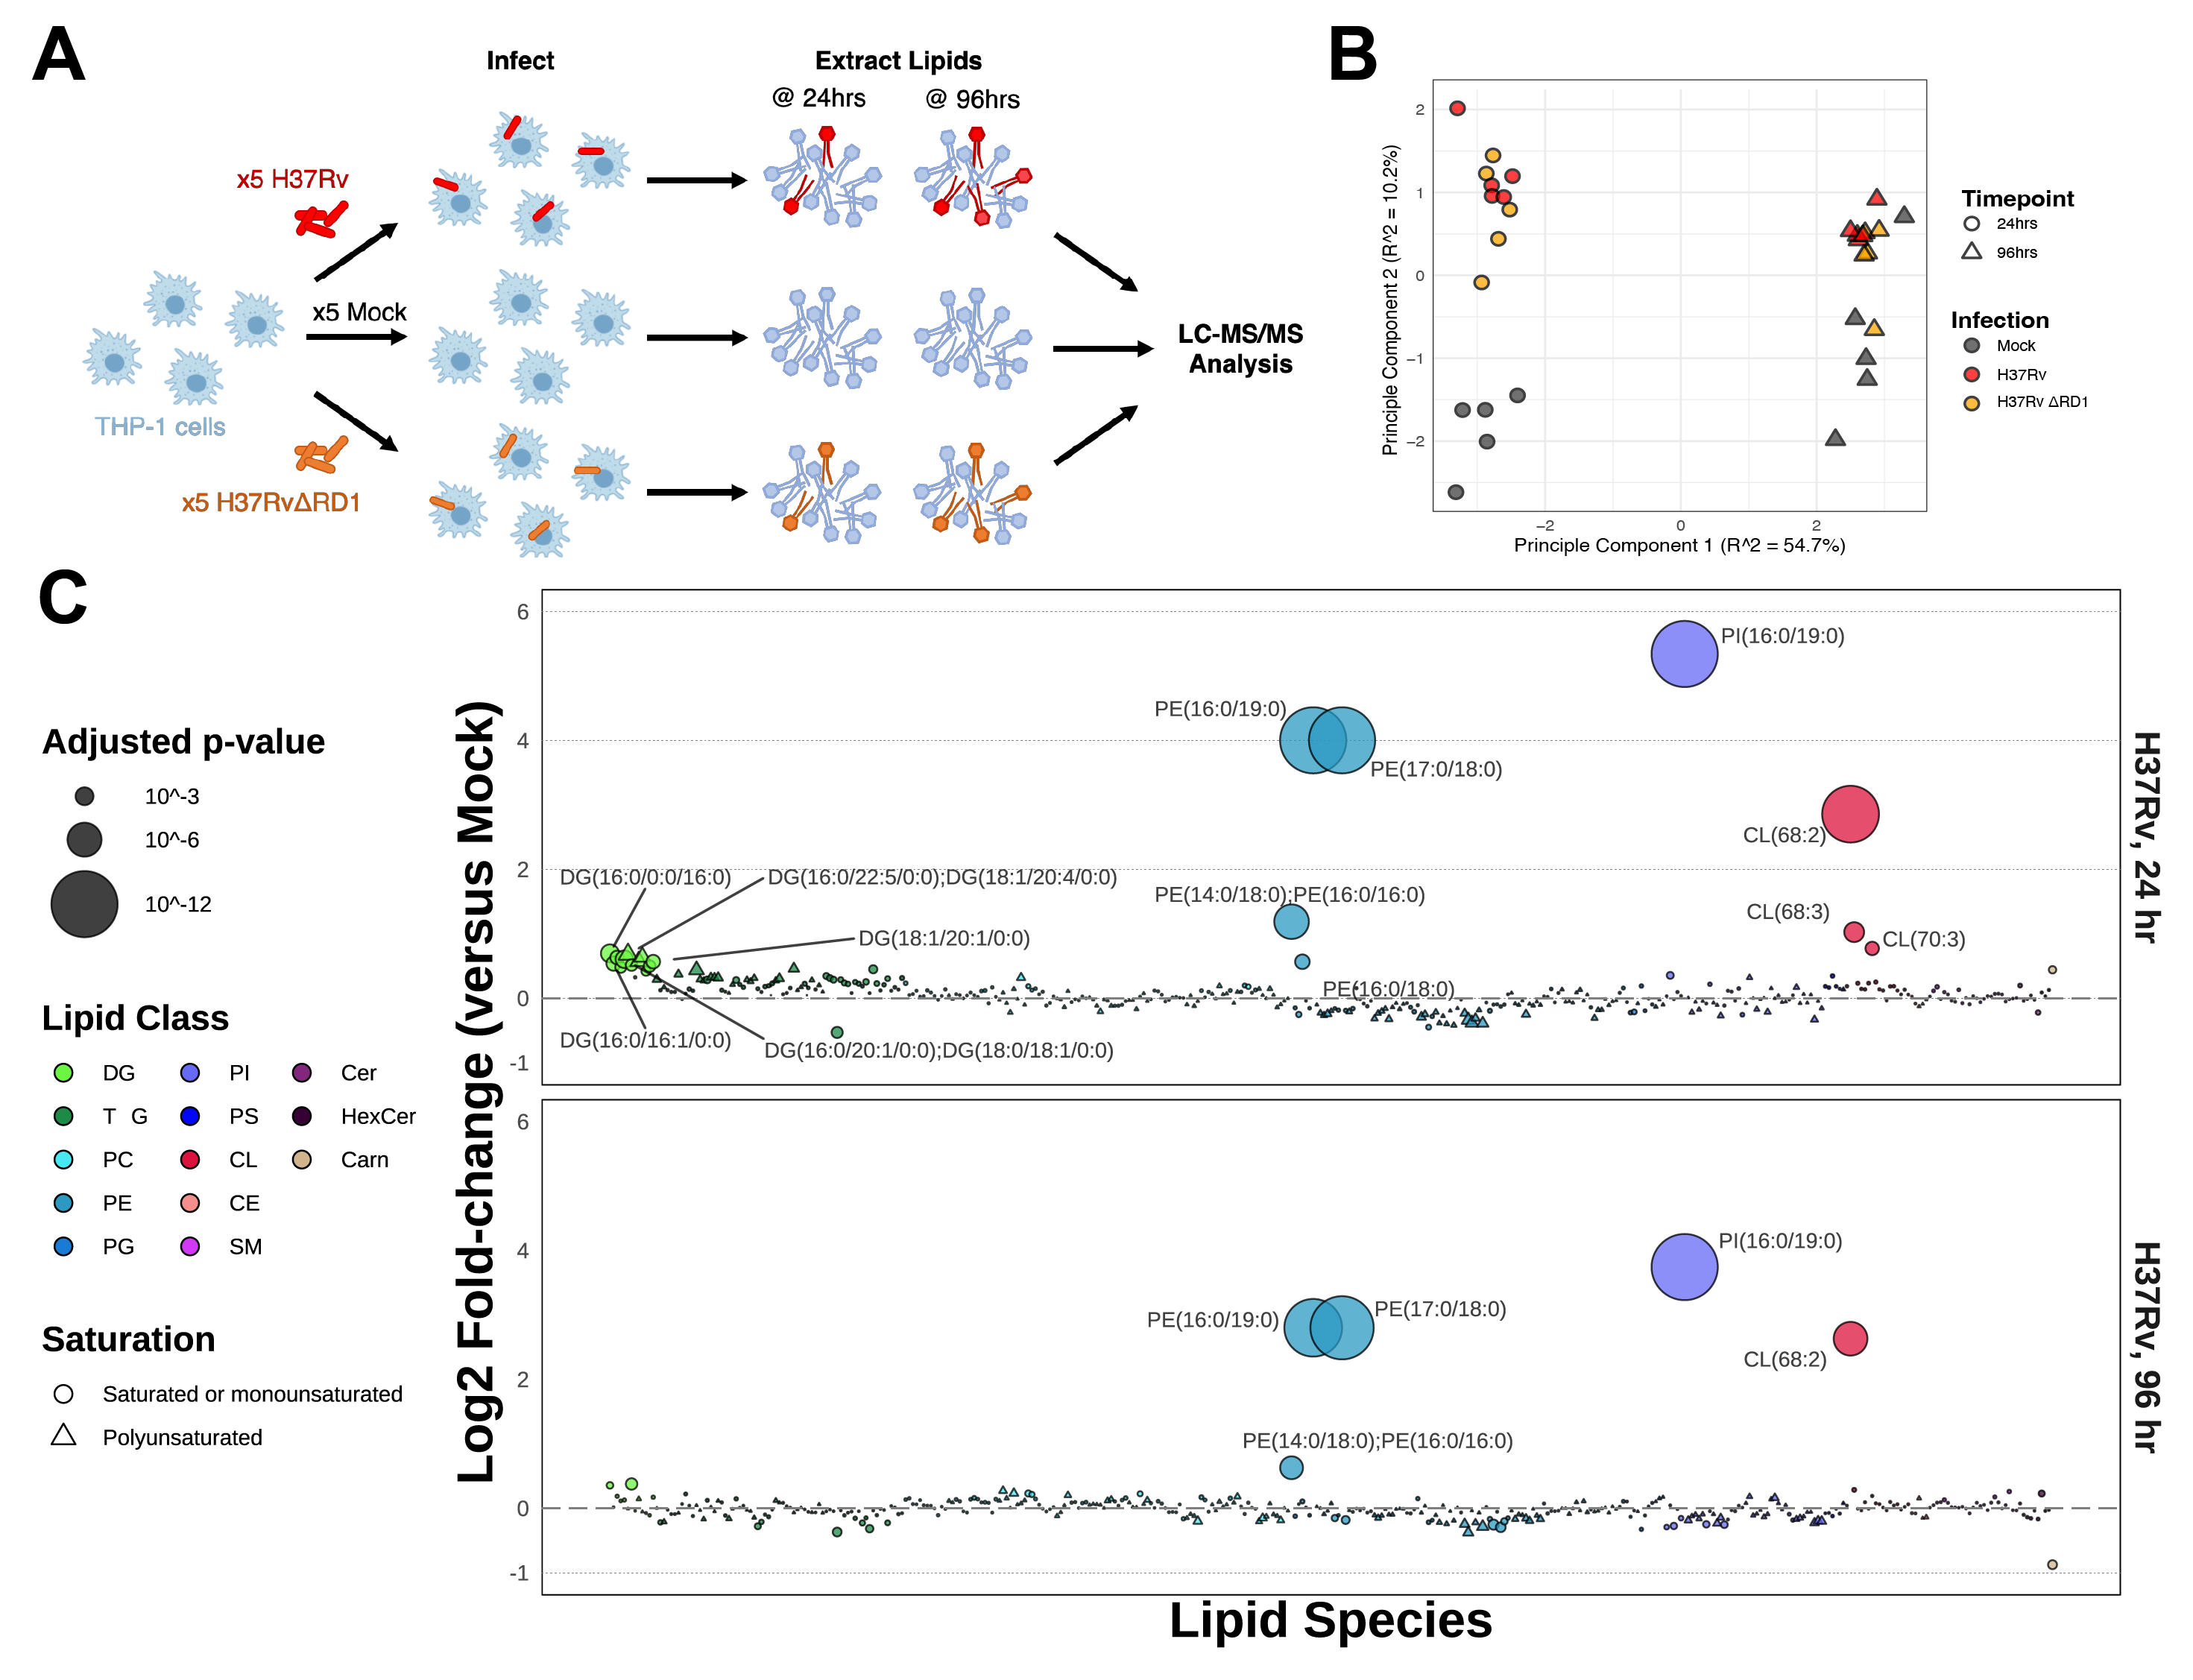
We performed untargeted lipidomics on human THP-1 monocyte-derived macrophages infected for either 24 hours or 96 hours with either the historical Mycobacterium tuberculosis strain H37Rv or with the attenuated deletion mutant strain H37Rv-ΔRD1 (ΔRD1) (Figure 5.1A). As control, we plated, incubated, and collected mock-infected cells to serve as a baseline control. We prepared all conditions in quintuplicate. Infection conditions were optimized to guarantee an infection rate of at least 70% for both time points for both infections (Figure S5.1). The total lipid content from the cells was extracted via the method of Bligh-Dyer, spiked with internal standards, and analyzed via liquid chromatography-electrospray ionization tandem mass spectrometry (LC-ESI-MS/MS) as previously described14,15. In total, 401 lipids were annotated and manually validated using LIQUID16, including 261 phospholipids, 82 glycerolipids, 34 sphingolipids, 18 cardiolipins, five cholesteryl esters, and one long-chain acylcarnitine. The abundance of each lipid was normalized to the intensity of the spiked internal standards for each sample and was then averaged between replicates across each condition (Figure S5.2). Principal component analysis on all Mtb-infected samples shows a broad bifurcation between 24- and 96-hour samples as well as a modest separation of infected samples from mock samples (Figure 5.1B).
The relative enrichment of each lipid in each infection condition is reported here as a log2-transformed fold-change (Log2FC) versus the time-matched mock control (Figure 5.1C and Figure S5.3A). An upward shift on the bubble plots denotes relative enrichment during infection, whereas a downward shift denotes relative depletion. Log2FC enrichment values ranged from: -0.52 (for triacylglycerol TG(44:0)) to +5.34 (for phosphatidylinositol PI(16:0/19:0)) for the 24-hour infection and -0.87 (for lipid carnitine(16:0)) to +3.74 (for lipid PI(16:0/19/0)) for the 96-hour infection. Four lipid species are overwhelmingly dominant in this dataset: PE(17:0/18:0), PE(16:0/19:0), PI(16:0/19:0), and CL(68:2), each increasing by more than 4-fold (and up to 16-fold) over mock-infected cells.
We applied a one-way Analysis of Variance (ANOVA) with Benjamini-Hochberg correction for multiple comparisons to attribute statistical significance to each lipid species for each infection condition. Twenty-four lipids were assigned p-values < 0.05 at 24 hours post-infection, and ten lipids at 96 hours. More significant changes occur at 24hrs, reflecting a metabolic burst in response to exposure to a pathogen and a return to baseline for many lipids by 96hrs.
Because these samples contain a composite of human lipids and infecting mycobacterial lipids, we sought to determine which of the identified lipids may be derived from Mtb. We thus cross-referenced these results with the MycoMass database12,17, an aggregated lipidomics database which characterizes the static Mtb lipidome across several Mtb strains, including H37Rv (curated by the lab of Dr. Branch Moody at Brigham and Women’s in Boston, MA). We aligned these datasets at the lipid species level (as opposed to the molecular lipid species, which describes the acyl chain composition of each lipid). We found that out of 401 lipids identified in these infection data, 88 overlap with this database. This includes some redundancy among hits that are indistinguishable at the lipid species level (e.g., the molecular lipid species PE(17:0/18:0) and PE(16:0/19:0) both match with PE(35:0) at the lipid species level, and it is unclear if one or both molecular lipid species are present in the MycoMass database). To aid in clarifying which lipids are most likely to be unique to Mtb, we plotted the ratios of infected versus uninfected data (Figure 5.2), partitioning data between human-only (absent from the MycoMass database) or potential Mtb lipids (present at the lipid species level in the MycoMass database).
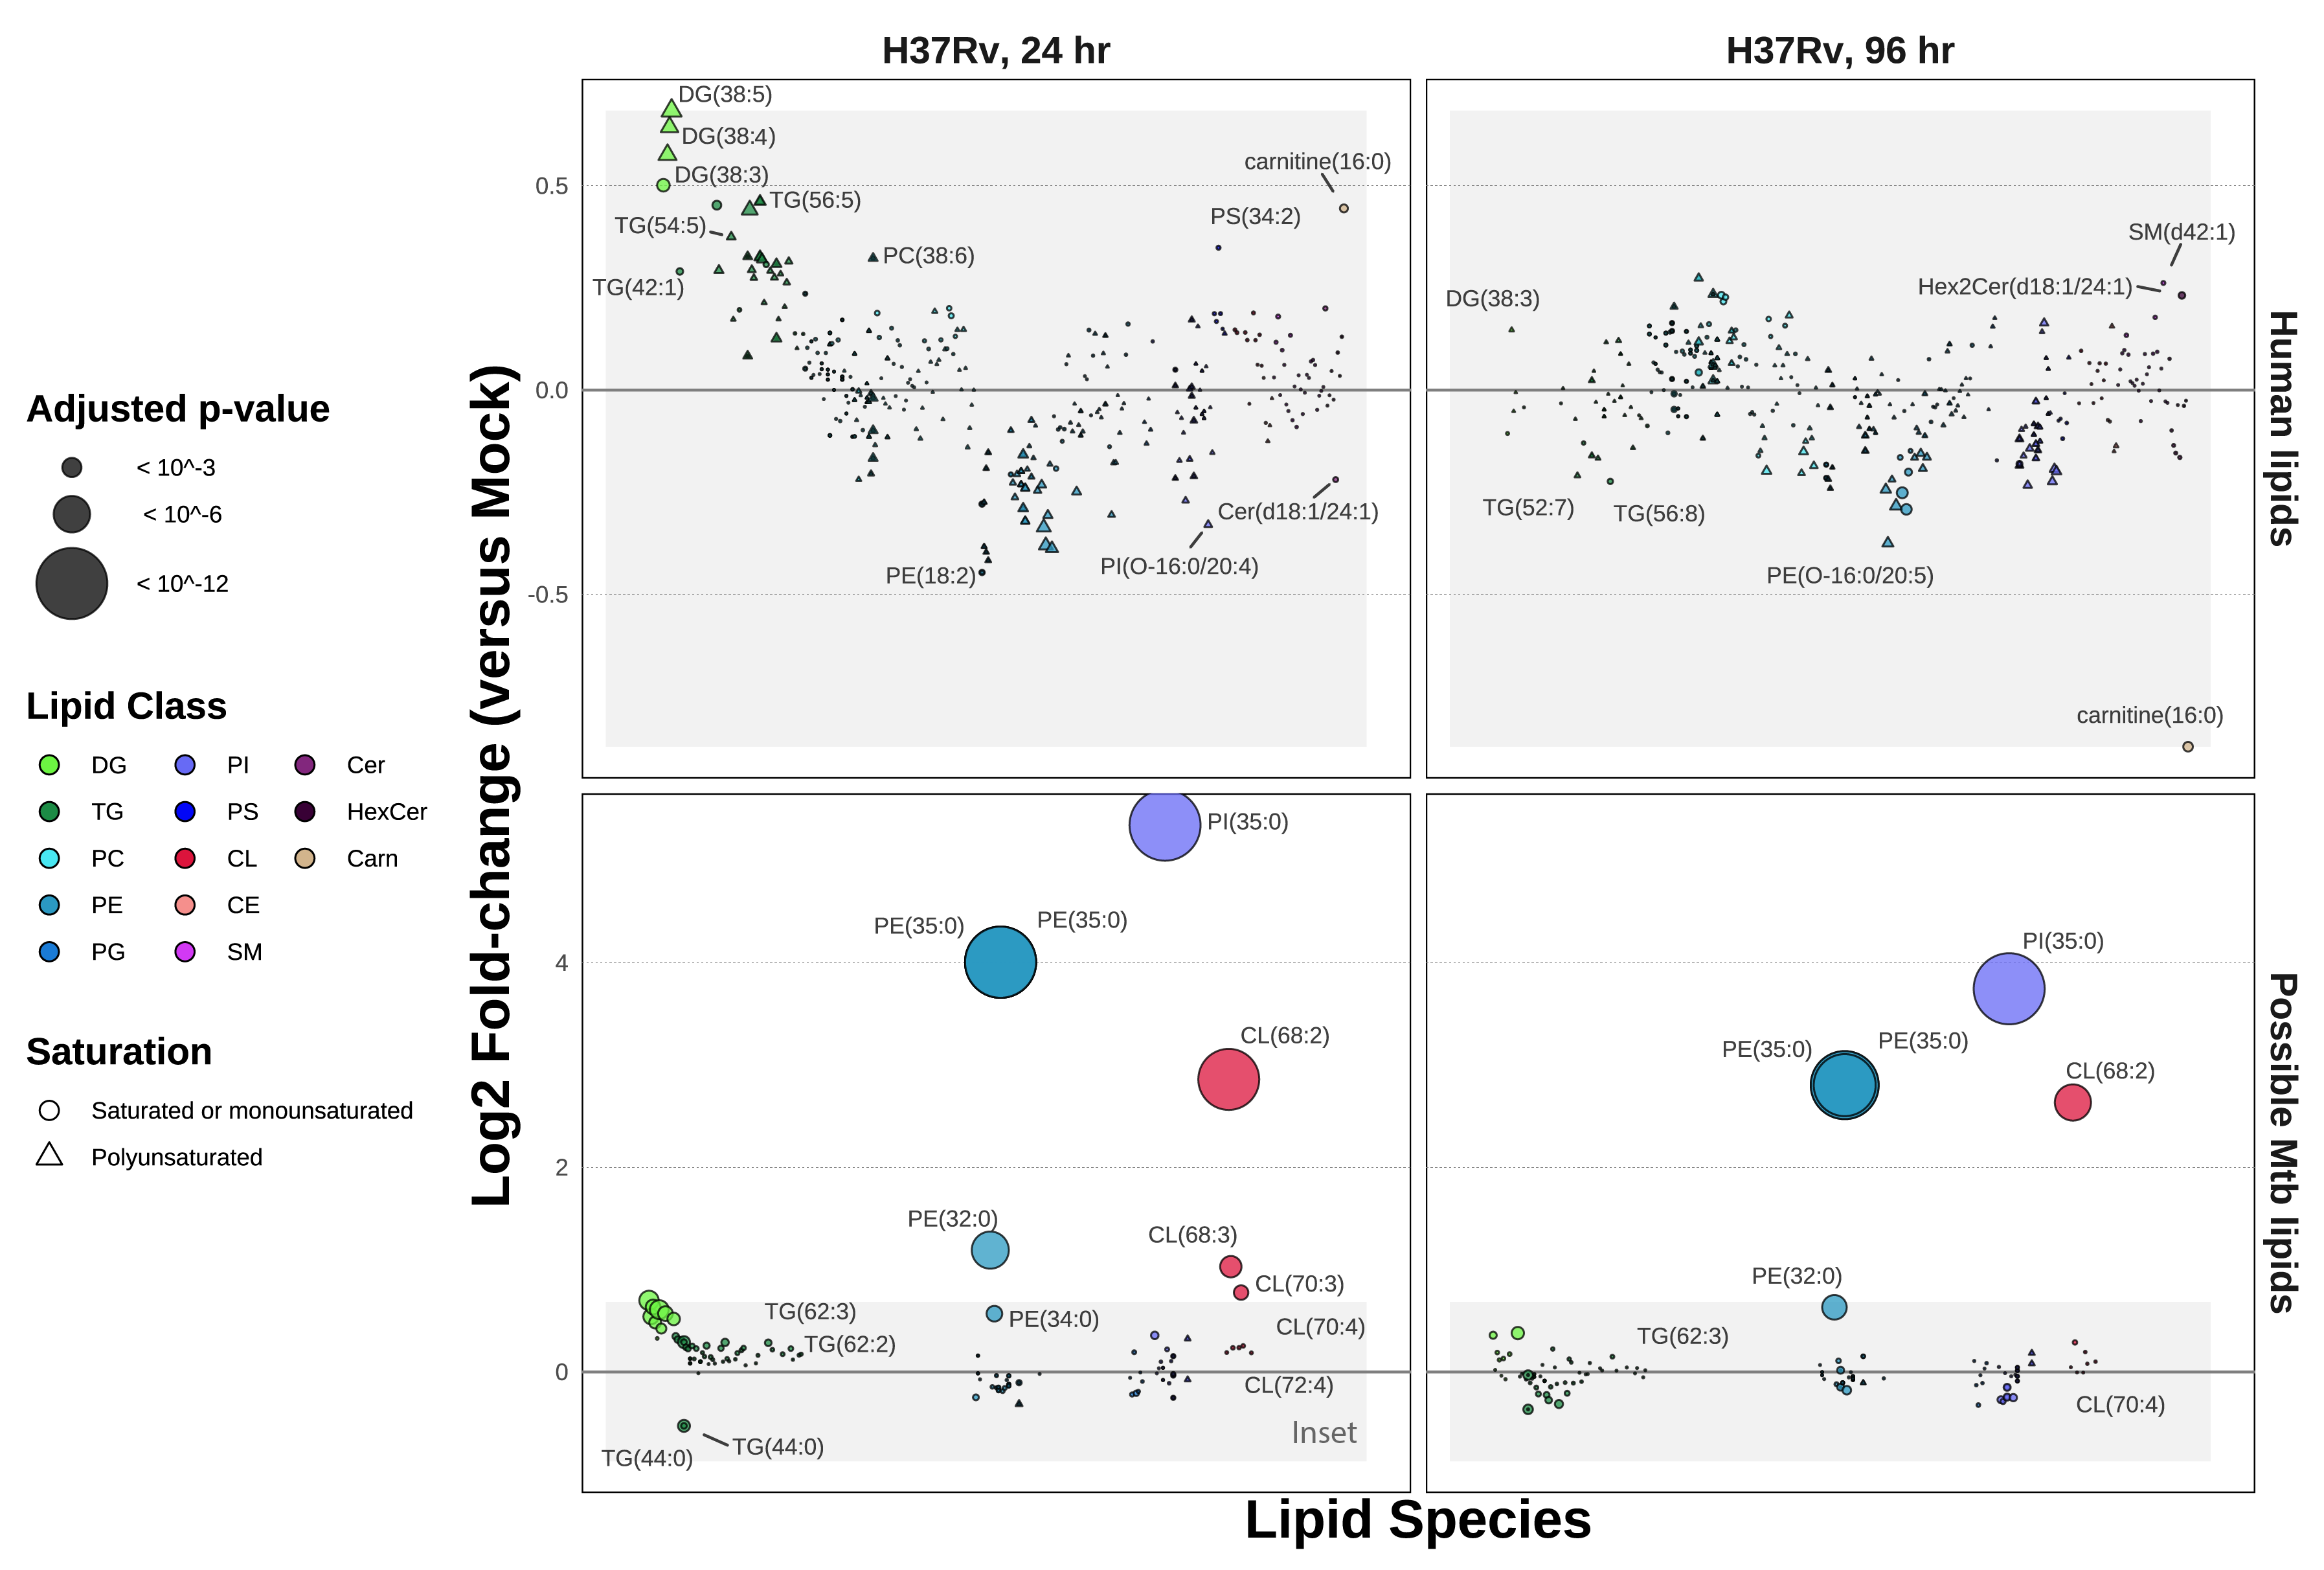
Notably, the three most enriched lipid species in H37Rv infection, PI(35:0), PE(35:0), and CE(68:2), are likely Mtb lipids. At the lipid species level of annotation, PI(35:0) is indistinguishable between its two possible constituents, PI(16:0/19:0) and PI(17:0/18:0). The same is true for PE(35:0). While C17:0 heptadecanoic acid is detectable (<1%) in human tissue and plasma18,19, C19:0 is not observed in human samples18. Thus, the odd-chain acyl composition of these highly abundant lipids may be the best designation for their being Mtb lipids.
In addition to its annotation in the MycoMass database, CL(68:2) was previously identified as a major Mtb lipid by Sartain et al. in their generation of the Mtb LipidDB in 201120. Sarma et al. characterized a cardiolipin synthase in Mycobacterium phlei with high homology to that of Mtb and postulate that the synthesis of cardiolipins allows Mtb to better survive within macrophages21. Others, such as Fischer et al., describe that host cells present mycobacterial cardiolipins to NK T cells using the antigen presentation molecule CD1d22.
Beyond the handful of massively enriched lipid species, it is difficult to determine the organismal source of the remaining 85 lipid species co-annotated in the MycoMass database. Further discountable are any “Mtb” lipids that are depleted during infection (A log2 fold-change < 0 between infection and mock samples) – this includes the majority of overlapping PE, PI, and PS species. When we apply a cutoff defined by the maximal fold-change among human (non-Mtb) lipids, only three additional lipid species appear enriched at 24 hours. Aside from these lipids, we postulate that the overall abundance of the remaining “Mtb” lipids in this dataset may be dominated by the host despite their co-annotation in the MycoMass database.
Considering the above, we note that most “human” diacylglycerides and triacylglycerides enriched at 24 hours post-infection contain polyunsaturated fatty acids. In contrast, the enriched “Mtb” DGs and TGs are composed of saturated or monounsaturated fatty acids. This observation supports the 2021 report by Laval et al., in which they show that Mtb infection stimulates PUFA DG production in the host that serves as carbon and energy for the invading Mtb23.
We also observe wide-spread depletion of polyunsaturated phospholipids, including ester-linked lipids (e.g., PE(O-16:0/22:5) and PI(O-16:0/20:4)), lysolipids (e.g., PE(18:2/0:0)), and plasmalogens (e.g., PE(P-14:0/20:4)) at 24-hours post-infection. The well-described roles of lysolipids and plasmalogens as antimicrobial lipid factors do not escape our attention24,25 – notably, in 2022 Jurkowitz et al. characterized a mycobacterial lysoplasmalogenase, MtbYhhN, that protects infecting Mtb against host-produced lysoplasmalogens26. We will discuss these lipids further below.
5.3.2 Comparing lipidomes during H37Rv and H37Rv-ΔRD1 reveals signatures of pathogenic Mtb infection
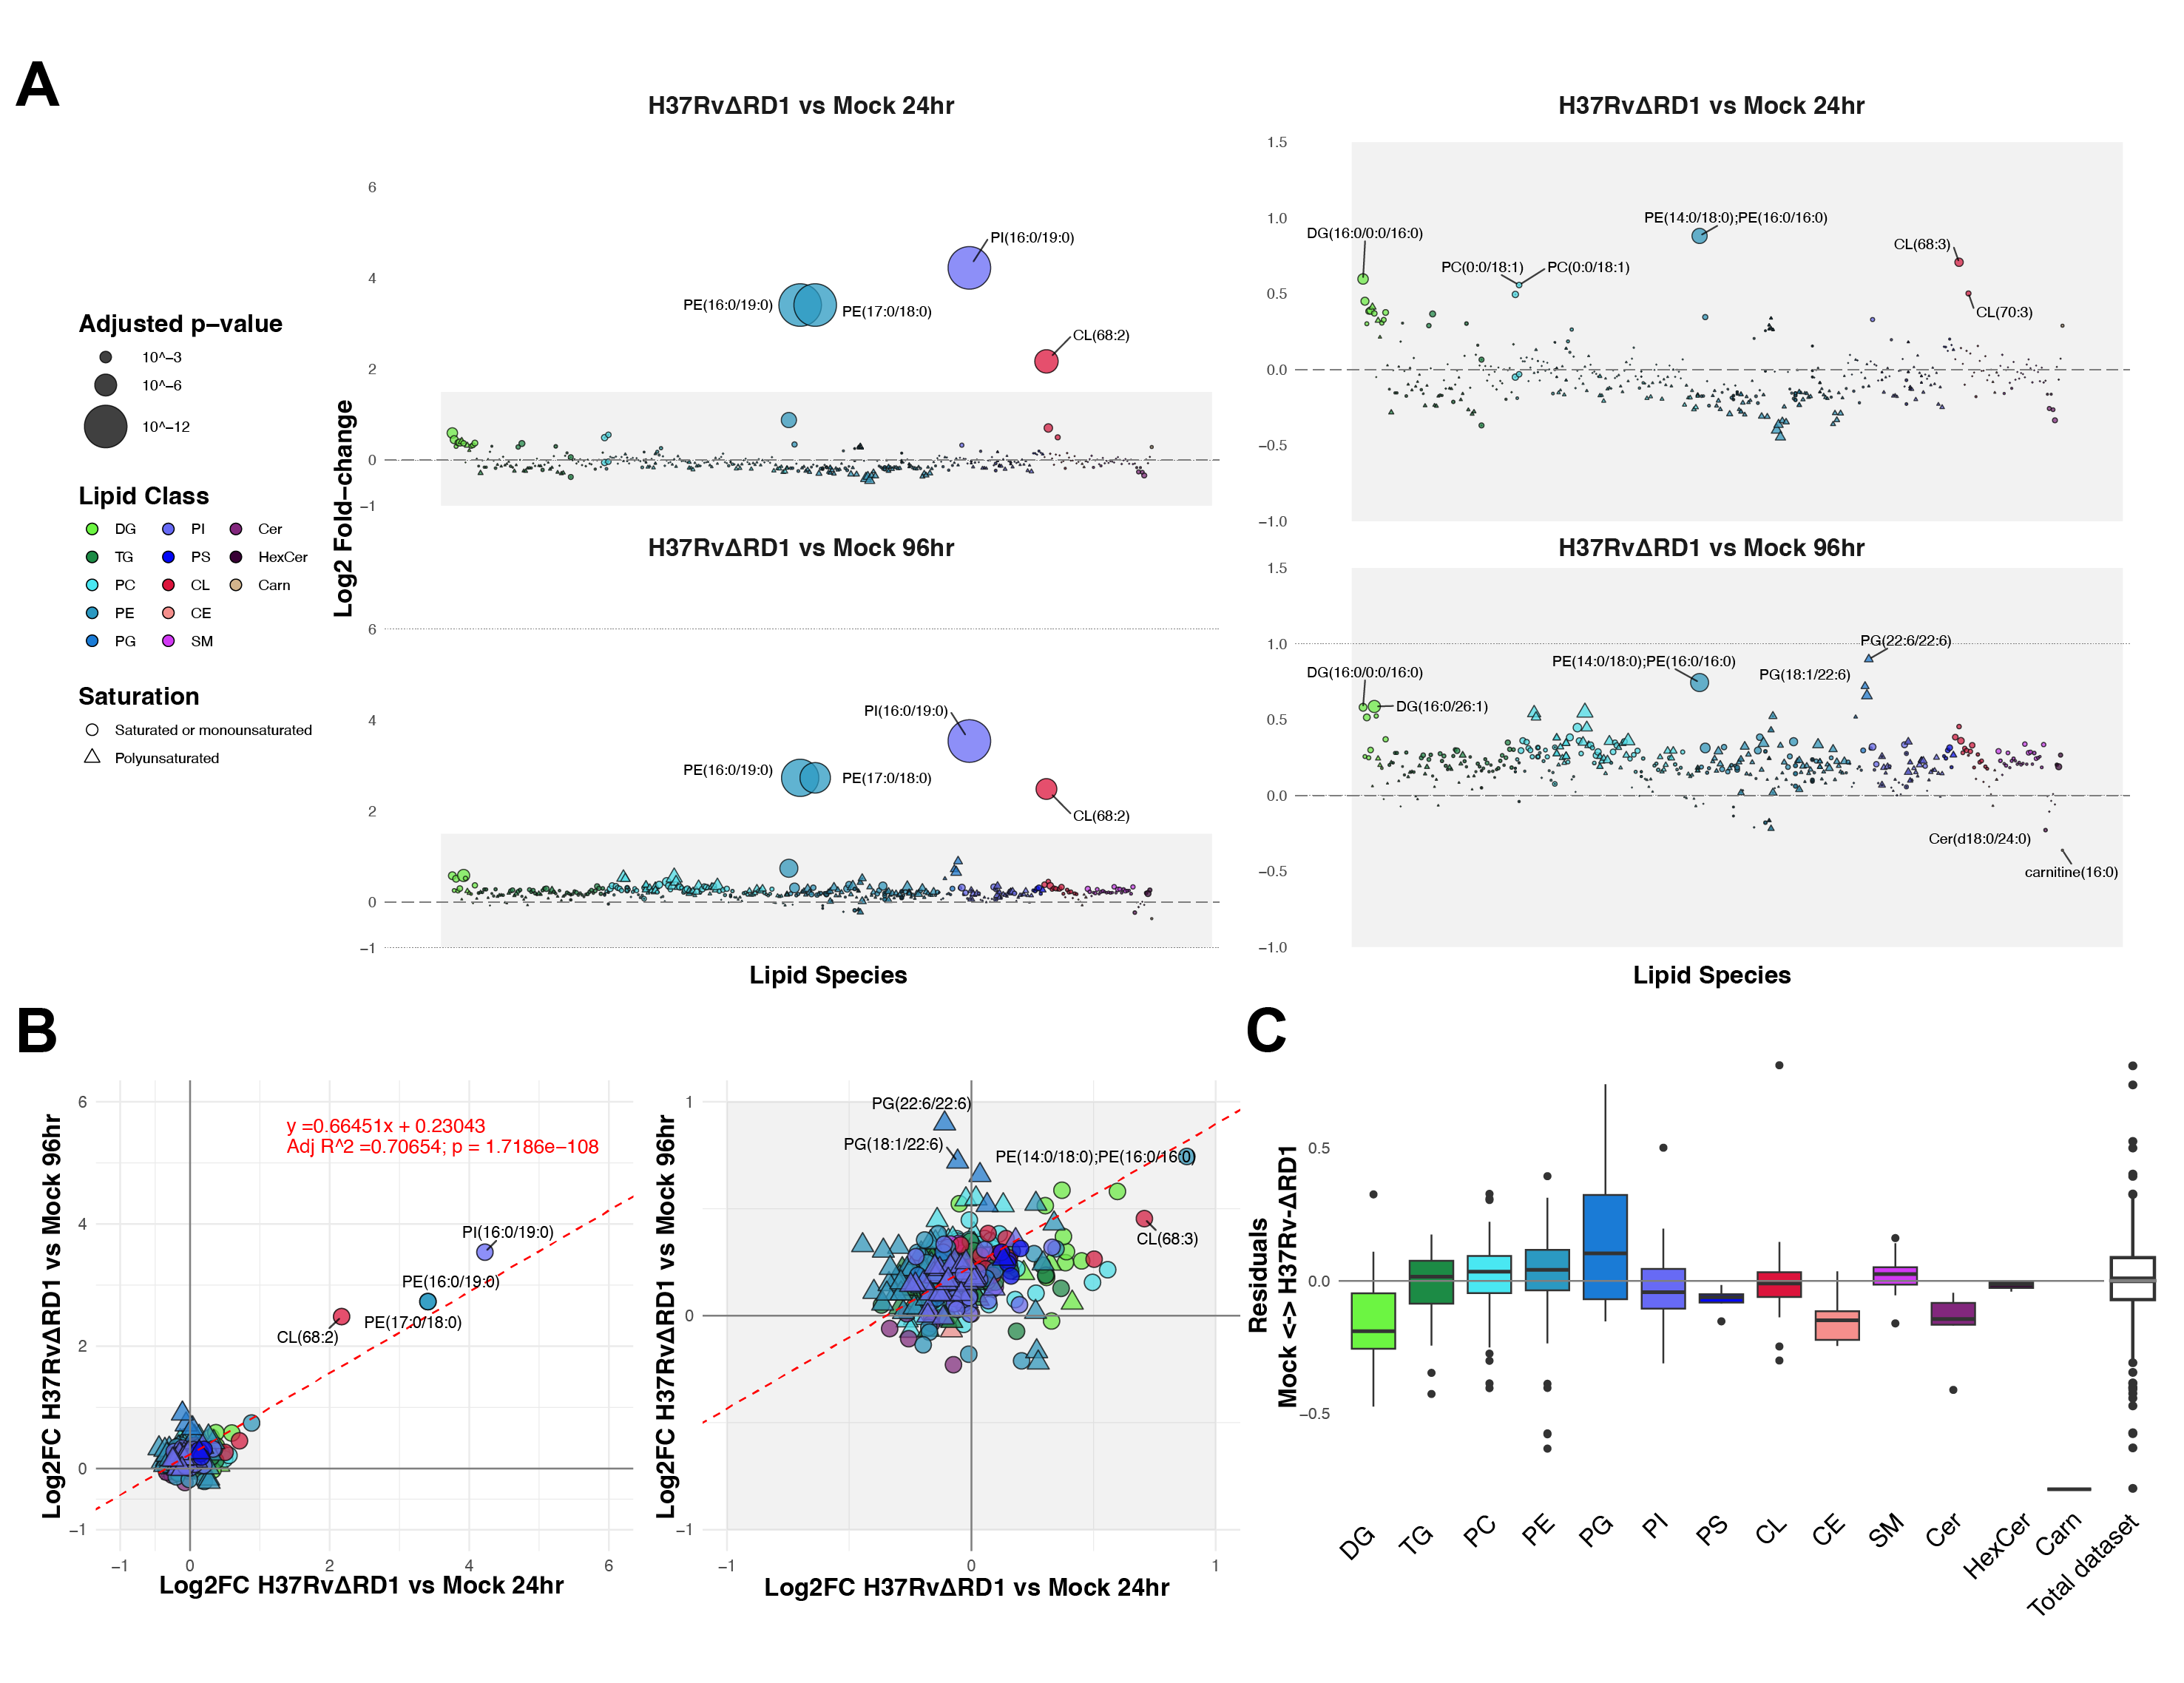
In addition to analyzing the effects of Mtb strain H37Rv infection, we prepared an analysis of cells infected with the attenuated deletion mutant Mtb strain H37Rv-ΔRD1. This mutant strain lacks the RD1 genomic locus, which contains the Mtb Type VII secretion system and many critical pathogenicity factors, including ESAT-6 and CFP-10. Lewis et al. reported in 2003 that the ΔRD1 strain mimics the vaccine strain of M. bovis, Bacille Calmette-Guerin27. As before, we infected cells for 24 and 96 hours before lipid extraction and mass spectrometric analysis. We find that H37Rv-ΔRD1 induces many changes to the host lipidome in comparison to mock-infected cells (Figure S5.3). We hoped to extract a signature for a pathogenic Mtb infection by mapping the differences between H37Rv and H37Rv-ΔRD1 infection. To this end, we compared the relative enrichment of lipids extracted during these infections (Figure 5.3). We faceted these data by timepoint and possible organismal source (“human” lipids versus “Mtb” lipids).

In viewing these comparisons, we observe several intriguing differences between these infections. At 24 hours post-infection, most DG species are equally abundant in both samples; this observation would suggest that the up-regulation of DG may be an effect of cell-intrinsic signaling initiated by mycobacterial uptake. At the same time, we observe significant enrichment of nearly all TG species toward H37Rv; this perhaps reflects lipid droplet formation in H37Rv infection, as prior reports show that the accumulation of lipid droplets is a notable difference between these two Mtb strains28.
Similarly, while we observed that many lyso-PE species, such as PE(22:6/0:0), are significantly depleted during infection with H37Rv, the ΔRD1 deletion mutant induces an accumulation of these lipids. These data strongly suggest that pathogenicity factors in the RD1 locus enable the bacterium to inhibit or degrade host lysolipids. In contrast, H37Rv-ΔRD1 seems to induce minimal plasmalogen accumulation: species such as PC(P-16:0/20:3) are significantly enriched toward H37Rv infection.
At 96 hours of infection, we see significantly different patterns. The most apparent trend is that the overall distribution is skewed heavily toward ΔRD1 – perhaps indicative of cytotoxicity in the pathogenic infection or reduced total lipids extracted in H37Rv-infected samples, despite internal standard normalization. Among the lipids most enriched toward H37Rv-ΔRD1 at 96 hours are polyunsaturated PG species, such as PG(22:6/22:6). Intriguingly, PG(22:6/22:6) and several other enriched PG species may be the structural isomer bis(monoacylglycerol)phosphate, which is enriched in multivesicular endosomes and is involved in lysosomal degradation. Previous reports have connected BMPs as factors that control mycobacterial growth in infected cells29. The abundance of signature Mtb lipids such as PI(16:0/19:0) is equivalent at this time point; this may suggest similar total bacterial content in each sample despite differences in the total lipid content extracted from infected cells.
5.3.3 Mtb cell wall components map to selective Mtb-infection-induced lipidomic effects
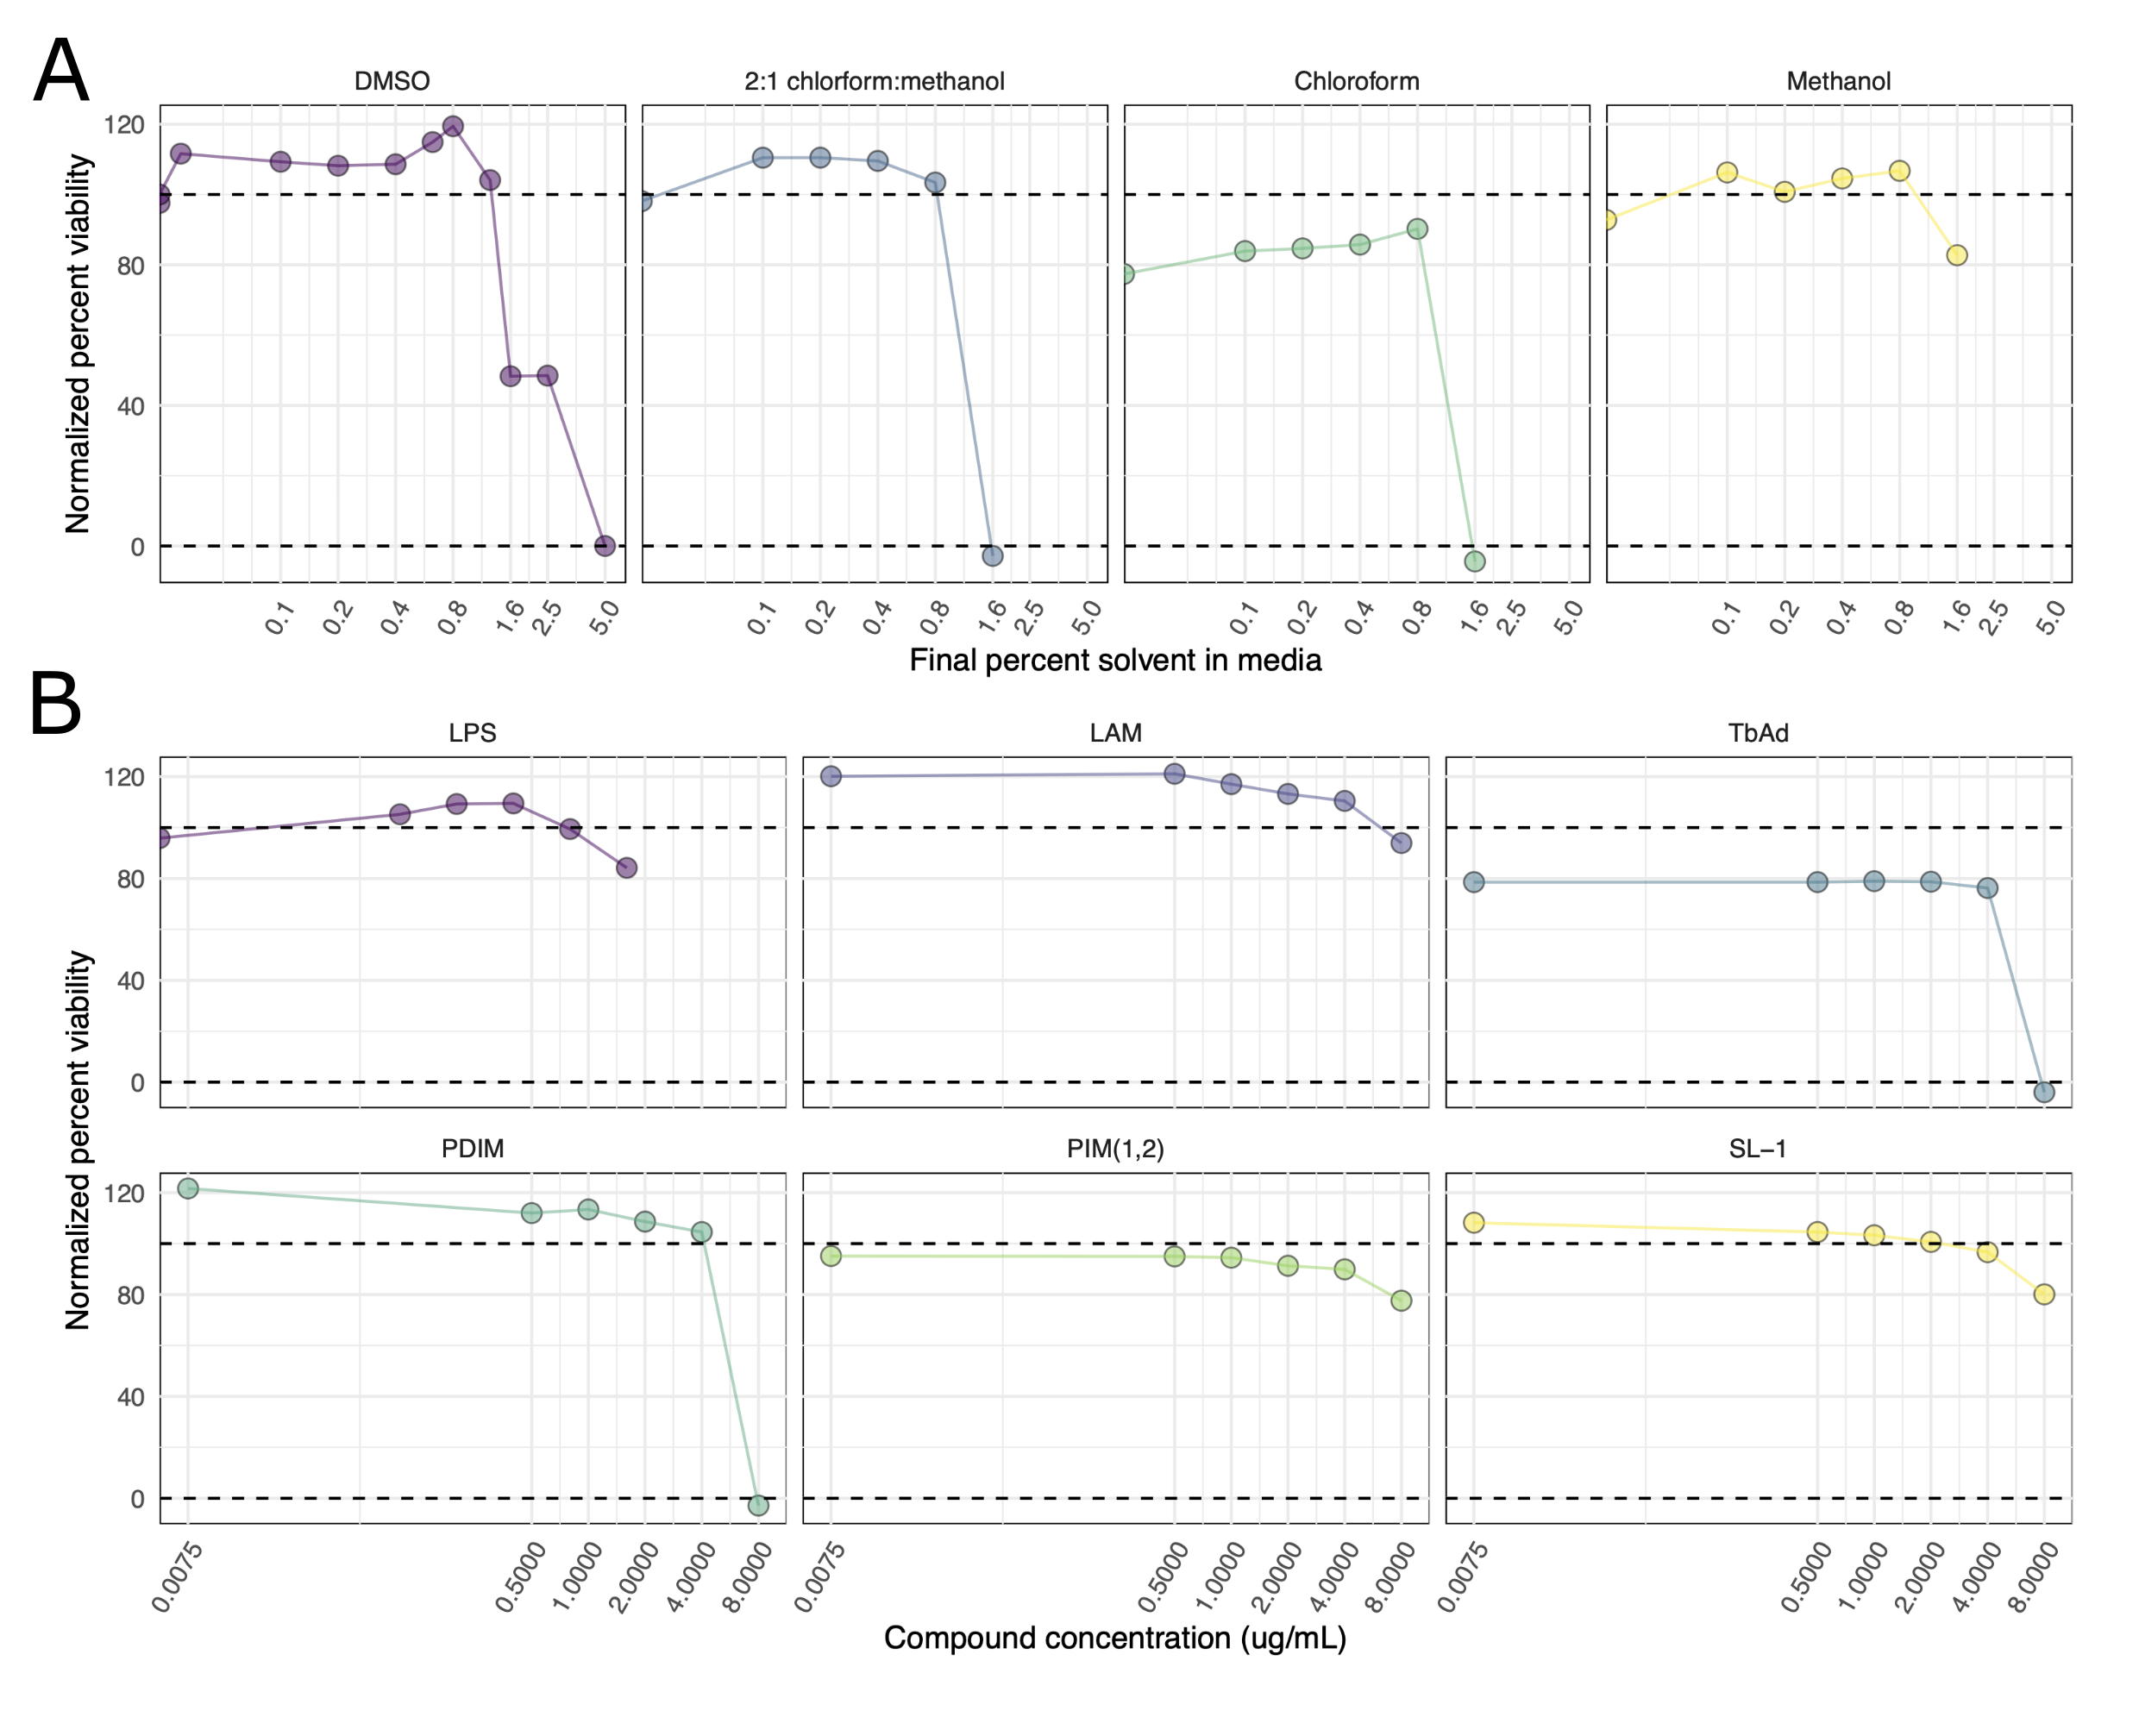
Finally, we hoped to map the effects of antigenic Mtb cell wall components to the effects of Mtb infection on the cellular lipidome. To this end, treated cells with the following purified compounds isolated from the Mtb cell wall: lipoarabinomannan (LAM), 1-tuberculosinyladenosine (1-TbAd), phthiocerol dimycocerosate (PDIM), phosphatidyl-myo-inositol dimannoside (PIM-1,2), and sulfolipid-1 (SL-1) (Figure 5.4A). Finally, we treated cells with lipopolysaccharide as a control for TLR activation and resulting PAMP-induced cellular signaling. We used viability assays to select concentrations of each compound with minimal cytotoxicity (Figure S5.4). Total lipid content from these treated cells was extracted via Bligh-Dyer extraction30, spiked with internal standards, and subjected to LC-MS/MS analysis. In these samples, we identify 377 unique molecular lipid species. Among these were 261 phospholipids, 69 glycerolipids, 29 sphingolipids, 17 cardiolipins, and one cholesterol ester. Principle component analysis shows the most significant separation was between the time points (Figure 5.4B, accounting for 54% of variability). We calculated the relative enrichment of each lipid in treated cells against cells treated with a solvent control (Vehicle), and we applied a one-way ANOVA to determine the statistical significance of each lipid (Figure 5.4B).
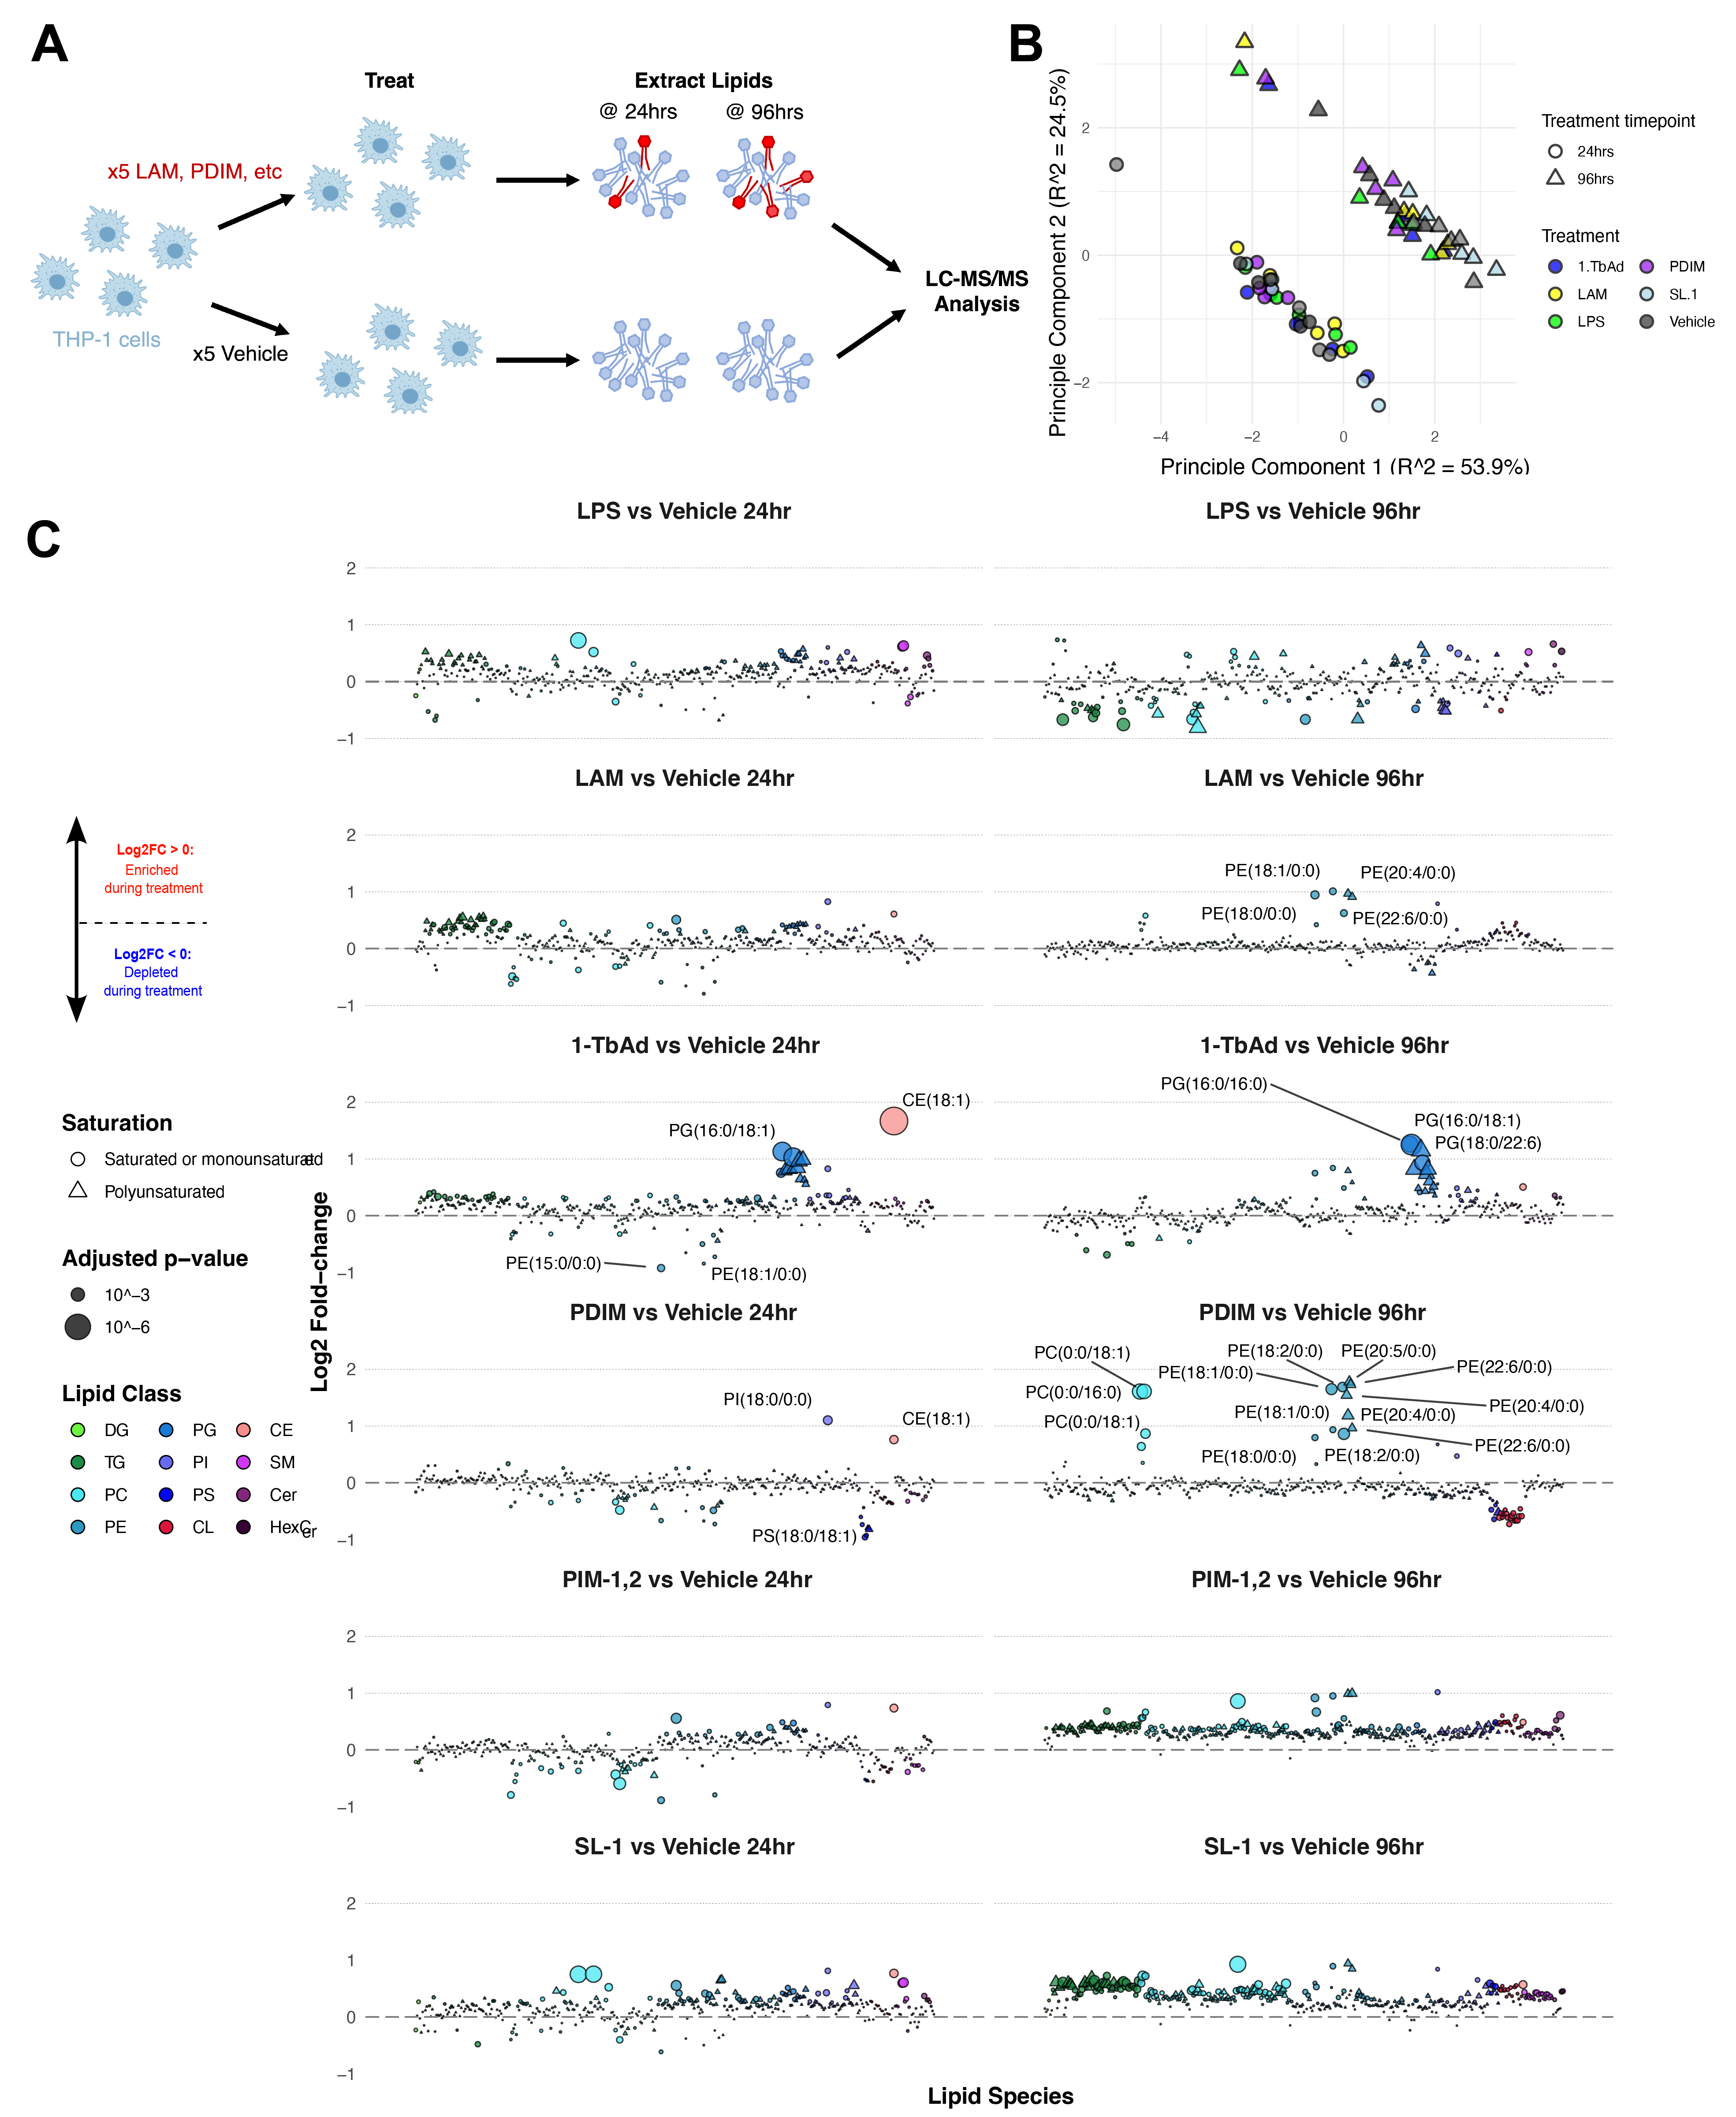
Among these data are clear checks of sanity. For example, Bedard et al. recently reported that treatment with 1-tuberculosinyladenosine induces lysosomal lipid storage, including lipids such as TG(52:2) and CE(18:1)31. Our findings recapitulate these results: we show that 24-hour 1-TbAd treatment induces significant up-regulation of many DG and TG species, PG, and the cholesteryl ester CE(18:1).
In a brief aside, we cross-referenced the treatment dataset with the MycoMass database. We found that 94 lipids are co-annotated (75 share identity with lipid species in the infection results described above). The maximum log2 enrichment of any lipid in any treatment comparison versus vehicle control is +1.65, further obfuscating a clear delineation between lipids that were certainly host-derived from those that were certain Mtb lipids.
These results capture many changes among the 377 lipids identified in the treatment samples. To simplify these results and glean greater understanding from the infection results, we prepared a map between the effects of infection and treatment on sub-categories of each lipid class.
5.3.4 Treatments with Mtb cell wall components recapitulate some, but not all, effects of Mtb infection
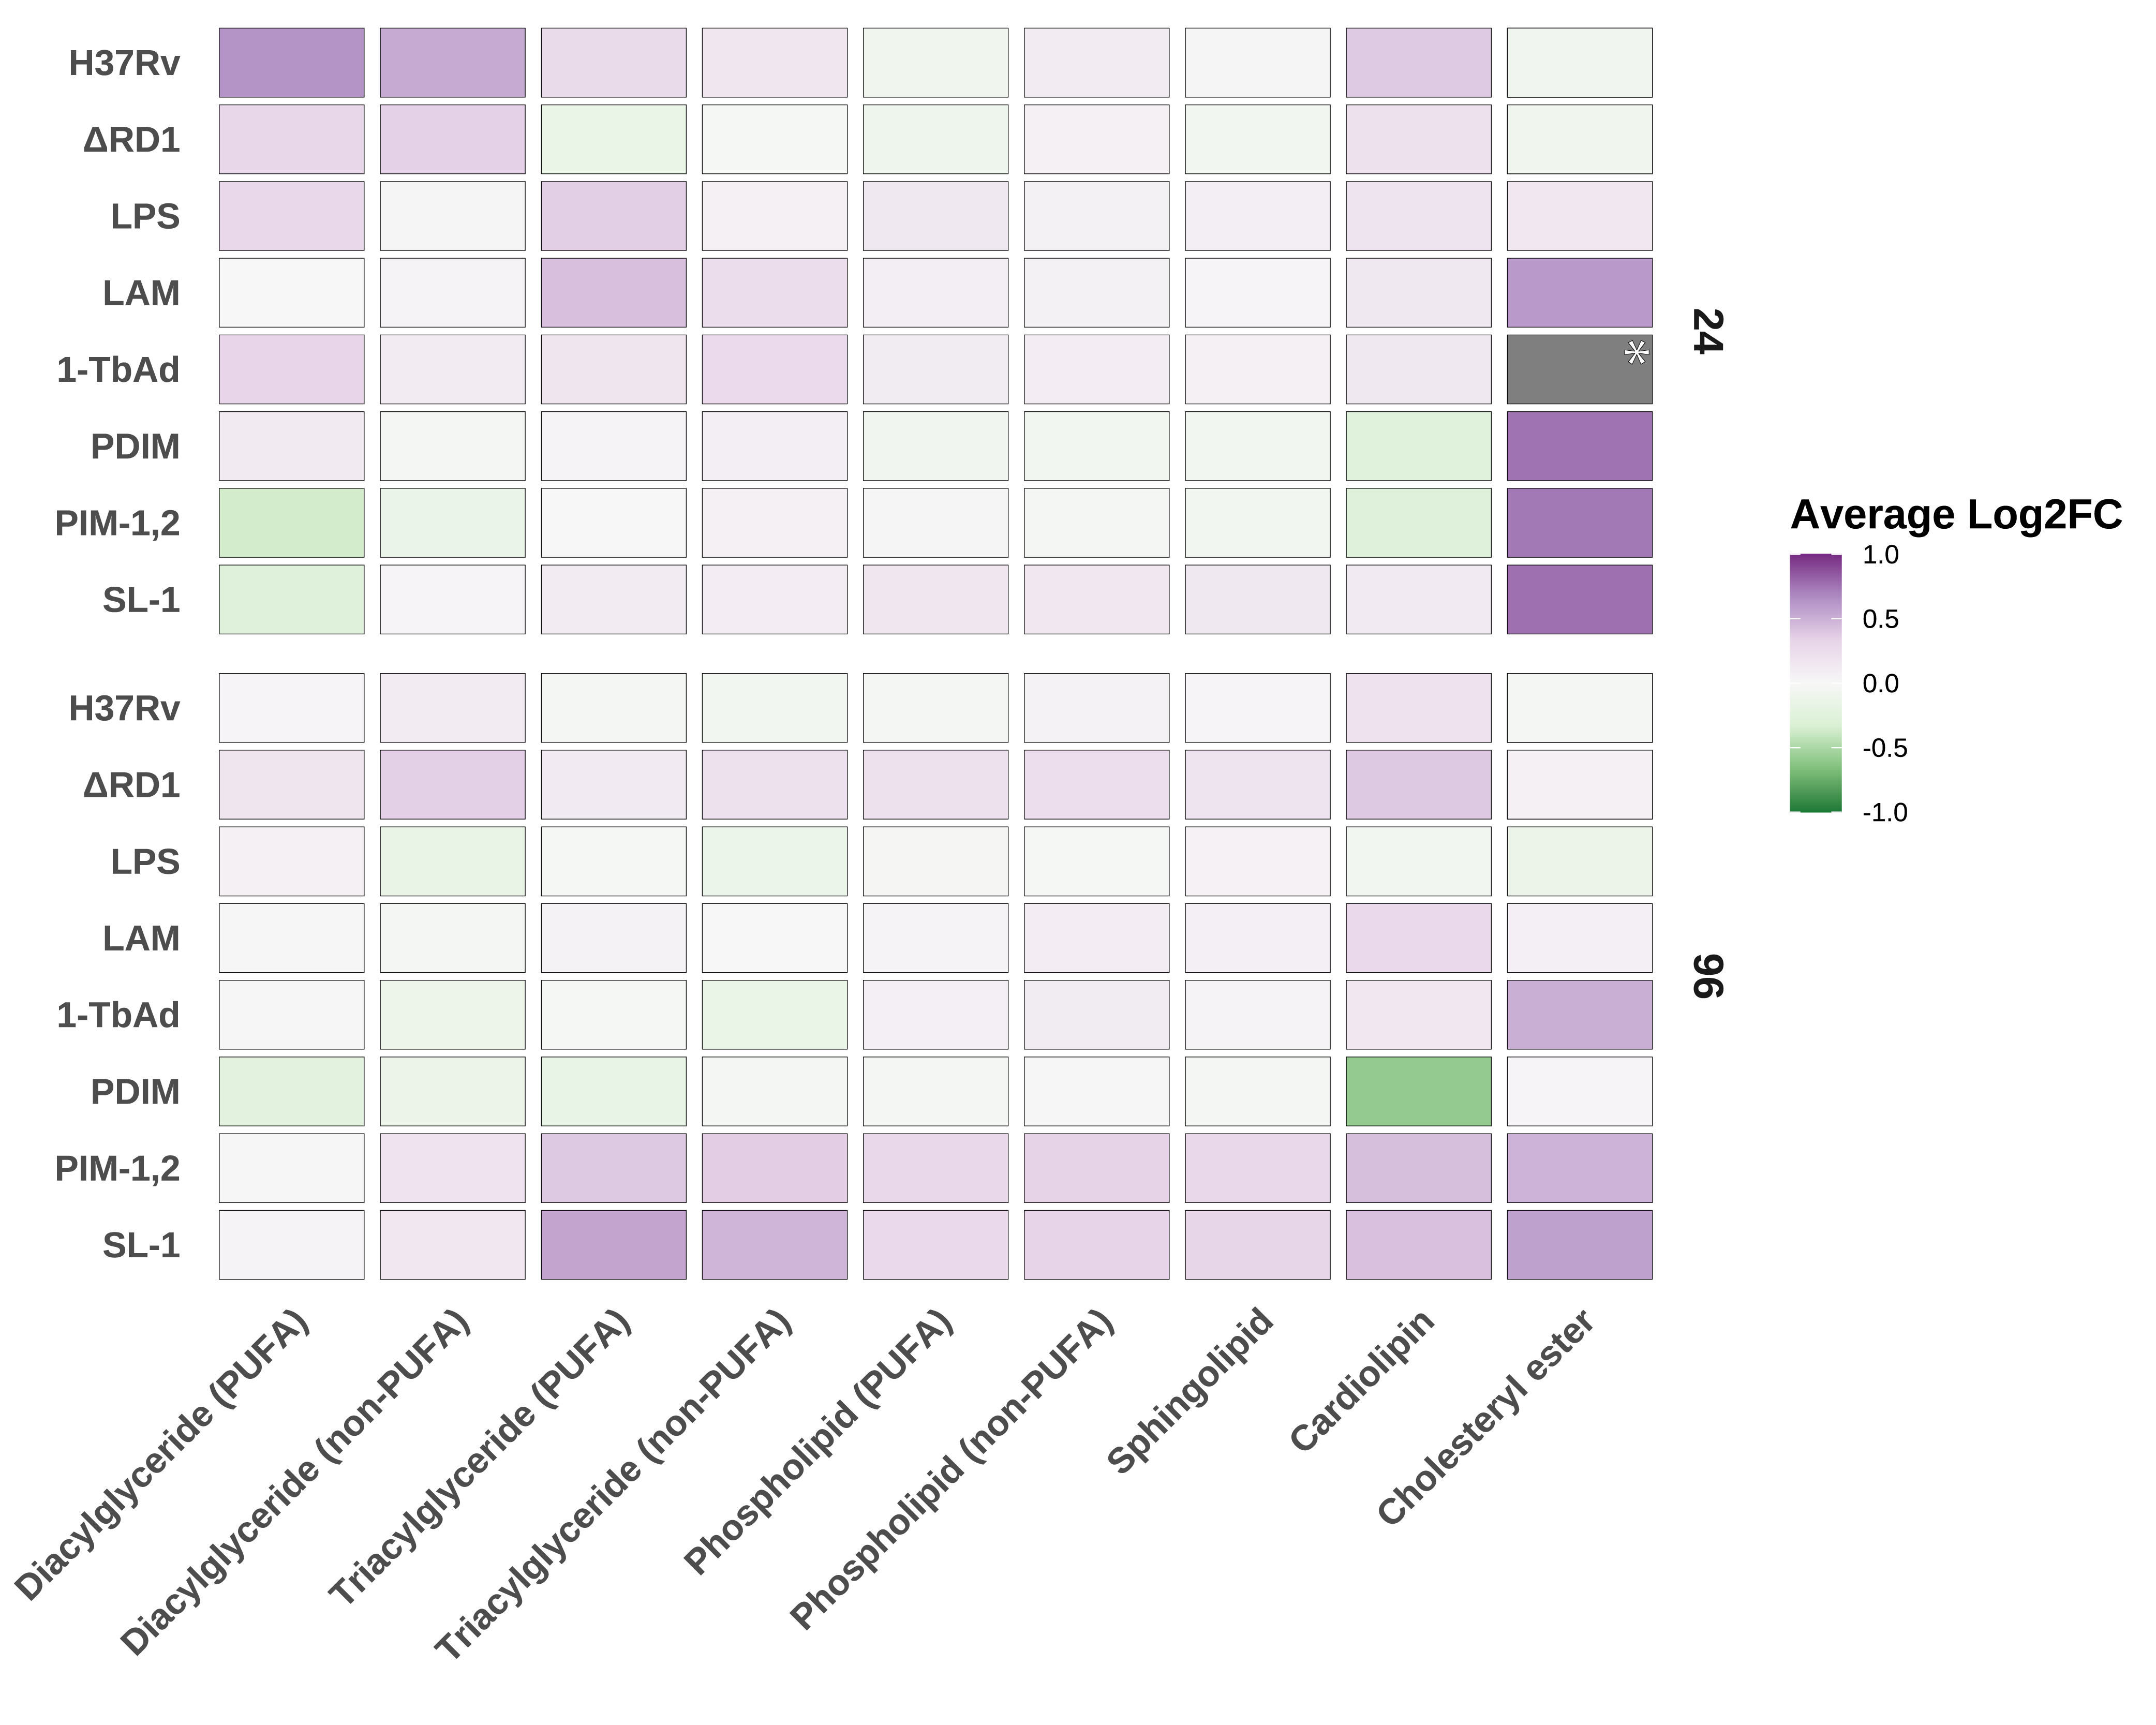
In order to map the specific changes of the lipidome that individual Mtb components induce with the changes induced by Mtb infection, we aggregated these data to the lipid class level (e.g., DG and TG), partitioned between PUFA and non-PUFA for appropriate classes, and aligned the average log2 fold-change versus control for each class (Mock for infection results, Vehicle for treatment results; Figure 5.5).
In these data, we observe that at 24 hours post-treatment start, LPS, LAM, and 1-TbAd all induce a dramatic increase in PUFA diacylglycerol. Because this was a primary signature of 24-hour infection, we postulate that the increase in DG results from pathogen recognition receptor (PRR) signaling. Prior studies have found that Mtb activates several PRRs during infection, including TLR2, Mincle, and NOD2 receptors32,33. At first glance, the similarity in DG accumulation between LPS and both attenuated and pathogenic infection would suggest some degree of TLR/Myd88 activation. Prior reports have shown that TLR2 is potently activated by Mtb glycolipids including LAM, mannose-capped LAM (Man-LAM) and phosphatidyl-myo-inositol mannosides (both PIM-1,2 and PIM-6)34 – as well as multiple lipoproteins (such as LprA, LprG, and LprH)35. However, Bedard et al. found no significant stimulation of PRRs following 1-TbAd treatment31. The biological significance of PUFA DG accumulation is yet to be determined.
Most compounds induce more significant effects at 24 hours than 96 hours. This trend is likely a result of compound deterioration or degradation. However, one exception to this trend is PDIM, which stimulates significant enrichment of lysophospholipids such as PC(0:0/18:1) and PE(18:2/0:0). Numerous prior reports show that PDIM directly disrupts TLR signaling36–38 and directly induces lysosomal membrane damage39. Augenstriech et al. report that PDIM inserts in host membranes and dissolves the membrane bilayer by inducing inverted hexagonal phase formation40. To date, no reports have established a link between PDIM and lysophospholipids.
Intriguingly, we observe several treatment effects which lie in opposition to those in infection. Among these, PIM-1,2 and SL-1 appear to stimulate a mild depletion in PUFA DG, whereas H37Rv stimulates significant enrichment in this category. Similarly, the bulk of CL species are enriched during infection, but treatment with either PDIM or PIM-1,2 induces a depletion of CL. What do these orthogonal patterns suggest? Ongoing work seeks to address this question, among many sparked by these data.
5.4 Discussion
In this study, we use untargeted lipidomics to investigate the effects that Mtb infection induces on the host lipidome. We are the first to use such a methodology to compare pathogenic and attenuated strains of Mtb, as we are the first to attempt to map these lipidomic changes to individual Mtb cell wall components. We identify several signatures of infection shared between pathogenic and attenuated infections and several signatures that may serve to distinguish these infections. Several such signatures may reveal concerted mycobacterial efforts to inhibit the host cell’s antimicrobial activity and lysosomal function. We next showed that treatment with a cohort of compounds derived from the Mtb cell wall induces profound changes to the host lipidome, some of which align with broad trends during infection and some of which appear to oppose the effects of a live infection.
First, we identify a cohort of four phospholipids and cardiolipins that appear to be mycobacterial in origin. These include PE(16:0/19:0), PE(17:0/18:0), PI(16:0/19:0), and CL(68:2). Alongside these lipids are a large number of lipids for which the source organism is inconclusive. Cross-referencing with the MycoMass Mtb database is a somewhat crude method of partitioning the lipid composition of an infected cell. Though, the fact that we measure only four probable Mtb lipids with high confidence is unsurprising: the Mtb plasma membrane is a complex structure with a unique and complex lipid composition41. Many of the classic Mtb lipids require a specialized lipid extraction protocol to identify20. In this study, the bias towards host lipids in lipid extraction likely exacerbated the overarching disparity between the biomasses of the host and the infecting bacilli.
Despite the inconclusive organismal source of many identified lipids, we observe several signatures of infection with both pathogenic and attenuated strains of Mtb. We see a broad and significant enrichment of diacylglycerols at 24 hours of infection in both strains. We postulate that this increase is in part due to the activation of pathogen recognition receptors during infection, as the Mtb antigen lipoarabinomannan and the bacterial endotoxin lipopolysaccharide both induce a similar short-lived burst of DG production.
Intriguingly, we observe several signatures that distinguish pathogenic and attenuated Mtb infections. For example, the pathogenic strain H37Rv induces a significant and broad up-regulation in triacylglycerol production, whereas infection with the attenuated deletion strain H37Rv-ΔRD1 results in no concerted change to total TG content. This trend among TG between the strains may reflect the accumulation of lipid droplets. Costa et al. report this precise observation: they show that other attenuated strains, such as H37Ra and BCG, result in delayed expression of lipid droplet-associated genes28. Complementation of the RD1 locus confers the ability to induce lipid droplets to these attenuated strains28.
Concurrent with this disparity in TG content, H37Rv induces a significant enrichment of acylcarnitine at 24 hours of infection – taken together, these results may suggest that the pathogenic strain is inducing an up-regulation in fatty acid and beta;-oxidation, utilizing TG as an energy source. Prior reports have described just such a mycobacterial program42,43. In this vein, Chandra et al. show that inhibiting fatty acid β-oxidation severely restricts the intracellular growth of Mtb and allows for enhanced clearance in mouse infection models43. Given these observations, we postulate that fatty acid β-oxidation inhibitors are prime candidates for future investigations.
Along with these differences, we also report that H37Rv infection induces a significant depletion of many lysophospholipids (e.g., PC(0:0/18:1) or PE(22:6/0)), ether-linked phospholipids (e.g., PI(O-16:0/20:4)), and plasmalogens (e.g., PE(P-14:0/20:4)). In contrast, the same cohorts of modified phospholipids are enriched in H37Rv-ΔRD1 infection, suggesting a concerted mycobacterial pathogenicity program which limits the accumulation of these structures during infection. Gil-de-Gomez et al. show that the hydrolytic cleavage of an acyl chain from PE directly follows LPS stimulation, enabling enhanced eicosanoid production from arachidonic acid released from phospholipids and triacylglycerides by phospholipase A2 cleavage24. Contrary to this report, however, we do not see enrichment of lyso-PE following treatment with LPS – though we do see numerous significant lyso-PI species upregulated following LPS stimulation. Our observation of plasmalogen depletion, however, aligns nicely with the findings of Jurkowitz et al., who show that a mycobacterial phospholipase A2 enzyme named MtbYhhN degrades lysoplasmalogens. This enzyme protects mycobacteria from the toxic effects of these lipids26. Accordingly, these lipids may present another potential route of HDT.
In conclusion, this study identified several signatures unique to pathogenic Mycobacterium tuberculosis infection. We propose that these signatures underlie previously unrecognized avenues toward novel host-directed therapies. For a pathogen of such global significance, no stone may lie unturned.
5.5 Methods
5.5.1 Cell lines, Mycobacterium tuberculosis strains, and Mycobacterium tuberculosis cell wall components
THP-1 cells were sourced from American Type Culture Collection (ATCC TIB-202) and cultured in RPMI 1640 medium (Thermo Fischer Scientific #11875119) supplemented with 10 % FBS (Seradigm), 1x Gibco Penicillin-Streptomycin (Thermo Fischer Scientific #15-140-163), and 1x Gibco Non-Essential Amino Acids (Thermo Fischer Scientific #11140050). Before experimental use, THP-1 cells were activated for 48 hours via treatment with 50 nM phorbol 12-myristate 13-acetate (PMA; Sigma-Aldrich P8139-1MG). All cell counting was done using a hemocytometer with trypan blue (Gibco) counterstain. Biological replicates represent cells plated, infected, and collected on separate days.
All Mycobacterium tuberculosis culturing and infection were conducted in a biosafety level 3 facility following general safety guidelines. Historical Mtb strain H37Rv and the attenuated RD1-deletion mutant strain H37Rv-ΔRD1 were gifts kindly given to us by Dr. David Lewinsohn at the Oregon Health & Science University and Portland Veterans Affairs Medical Center; H37Rv-ΔRD was first produced by the lab of Dr. Sherman27. All Mtb strains were cultured at 37 °C in Difco™ Middlebrook 7H9 (Becton Dickinson #271310) broth medium supplemented with 10% Difco™ Middlebrook oleic acid-albumin-dextrose-catalase enrichment (OADC; Beckton Dickinson #L12240), and 0.1 % Tween-80 (Thermo Fisher Scientific #BP337-500), and carefully maintained between 600nm optical density (OD600) of 0.1 and 1.5 to sustain expression of pathogenicity factors.
Mycobacterium tuberculosis cell wall components were acquired as described below.
5.5.2 Mycobacterium tuberculosis infection
THP-1 cells were plated and activated in quintuplicate as above on 6cm tissue culture dishes at a density of 1.6x10⁶ cells per dish and left to activate for 48 hours. On the day of infection, cultures of both H37Rv and H37Rv-ΔRD1 were pelleted and washed 1x with PBS at 2000 xg. Bacterial pellets were resuspended via repeated passage through an 18-gauge blunt-tipped needle and filtered through a 5 μm filter to prepare a single-cell suspension of bacteria in RPMI 1640. Bacterial concentration was estimated by taking an OD600. Infectious solutions were prepared at a multiplicity of infection (MOI) of 3:1 (bacteria:cells) for the 24-hour samples and an MOI of 1:1 for the 96-hour samples; these MOIs were selected in optimization to guarantee a rate of infection >70% while minimizing host cell death at 96 hours (Figure S5.1). Cells were incubated at 37°C with 5% CO2 for 24 hours. At 24 hours post-infection, all host cell plates were washed 2x with PBS to remove non-internalized bacteria. At this point, 24-hour plates were collected as described below, while fresh media was added to 96-hour samples, and plates were left to incubate at 37 °C and 5 % CO2. Lipid extracts were performed as described below.
5.5.3 Mycobacterium tuberculosis cell wall treatments
THP-1 cells were plated and activated in quintuplicate on 6cm tissue culture dishes at a density of 1.6 x 10⁶ cells per dish. After 48 hours of activation, cell media was replaced with media containing bacterial components at the below concentrations for either 24 or 96 hours until lipid extractions were performed as described below in Methods Section 5.5.5. The Chloroform:Methanol solvent solution was selected as the vehicle control because it had the highest relative cytotoxicity of the solvent solutions tested (Figure S5.4A). Treatment concentrations were selected based on the results of the resazurin viability assay described below in Methods Section 5.5.4 (Figure S5.4B).
The vehicle control (Veh) consisted of chloroform:methanol (2:1 vol:vol) at a final concentration of 0.1% of cell media. Lipopolysaccharide (LPS) was added to cells at a final concentration of 0.5 μg/mL in PBS. 1-tuberculosinyladenosine (1-TbAd) was added to cells at a final concentration of 1 μg/mL in methanol; this compound was kindly provided to us by Dr. Branch Moody of the Department of Immunology at Harvard, Cambridge, MA. Lipoarabinomannan (LAM) was added at a final concentration of 1 μg/mL in methanol:H2O (2:1) (BEI Resources # NR-14848). Phthiocerol dimycocerosate (PDIM) was added at a final concentration of 1 μg/mL in chloroform:methanol (2:1) (BEI Resources # NR-20328). phosphatidyl-myo-inositol dimannoside (PIM-1,2) was added at 1 μg/mL in methanol (BEI resources # NR-14846). Sulfolipid-1 was added at a final concentration of 1 μg/mL in methanol (BEI Resources # NR-14845). These concentrations were selected for their limited cytopathic effect, assayed in Figure S5.4A & B.
5.5.4 Resazurin Viability Assay
THP-1 cells were plated and activated in clear-bottom 96-well plates at a density of 2 x 10⁴ cells per well. After 48 hours of activation, cell media was replaced with media containing dilutions of each compound or solvent denoted in Methods Section 5.5.3 A and B at the denoted concentrations. Cells were then incubated at 37 °C for 96 hours in the presence of compounds and solvents. At the end of the 96-hour treatment, 10 μL of a 0.5 mg/mL stock solution of resazurin reagent in DMSO was added to each well and mixed thoroughly. Cells were incubated with resazurin for 3.5 hours at 37 °C before being read on a ClarioStar Plus fluorescence plate reader (BMG Laboratories). Cell viability was calculated from the ratio of OD570:OD600; the dynamic range was established using untreated control wells (defined as 100 % viability) and wells treated with 5 % DMSO (0.15 mg/mL; defined as 100 % lethal). We report viability as a percentage using the formula below:
5.5.5 Lipid extraction & sample preparation
At the designated time point of infection or treatment, lipids were extracted through a modified Bligh-Dyer protocol30. Culture media was aspirated and cells were washed 2x with ice-cold PBS before being scraped into a 2:1 solution of ice-cold methanol:water and transferred to a glass vial containing ice-cold chloroform. Plates were scraped a second time with methanol:water, and cells were again transferred to chloroform to produce a final solution of 2:1:2 methanol:water:chloroform. Samples were vortexed for 30 seconds and left to separate into a biphasic solution for 1 hour at -20 °C. The lower phase of chloroform was carefully transferred to a new glass vial using a glass pipette. An equal volume of isotopic internal standards (Avanti Polar Lipids, EquiSplash™) was added to each sample and thoroughly mixed. Finally, samples were dried under the flow of N2 gas and stored at -80 °C.
5.5.6 Mass spectrometric analysis
Mass spectrometry analysis was performed as previously described14,15,44,45. LC-MS/MS instrumentation consisted of a Waters Acuity UPLC H class system interfaced with a Velos-ETD Orbitrap mass spectrometer. Samples were again dried in vacuo and resuspended in a 1:54 solution of chloroform:methanol (v:v) and injected onto a reverse-phase Waters CSH column and separated over a 34 min gradient (mobile phase A: acetonitrile/H2O (40:60, v:v); mobile phase B: acetonitrile/isopropanol (10:90, v:v) containing 10mM ammonium acetate) at a flow rate of 250 μL/min. Both positive- and negative-mode analyses were employed, using higher-energy collision dissociation and collision-induced dissociation to maximize lipidome coverage. The fragment ions used for lipid identifications were used as previously described44; in summary, these LC-MS/MS raw data files were analyzed using the LIQUID software16 and all subsequent identifications were manually validated by examining the fragmentation spectra for diagnostic and fragment ions corresponding to the parent acyl chains. For quantification, a reference database was created using LIQUID16 and then aligned to a reference database based on their identification, m/z, and retention times using MZmine 246. Aligned features were then manually verified, and peak apex intensity values were exported for statistical analysis.
5.5.7 Data analysis and presentation
For Mtb-infected samples, 30 and 29 LC-MS runs were completed in negative and positive ionization mode, respectively. One 24-hour Mock sample was lost in preparation for positive ionization mode. Negative and positive ionization mode data had 179 and 240 unique lipids identified in at least one sample, respectively. There were two missing observations in the negative and none in the positive ionization data. Missing observations were coded as NA values. All abundances were log2 transformed.
For samples treated with Mtb-derived components, 70 and 70 LC-MS runs were completed in negative and positive ionization mode, respectively. Negative and positive ionization mode data had 184 and 210 unique lipids identified in at least one sample, respectively. There were nine missing observations in the negative and none in the positive ionization data. Missing observations were coded as NA values. All abundances were log2 transformed.
A robust Mahalanobis distance based on lipid abundance vectors (rMd-PAV) was calculated to identify potential sample outliers in the data47. This distance is calculated based on four metrics: average correlation with samples in the same condition, skewness of lipid abundance distribution, kurtosis of lipid abundance distribution, and median absolute deviation (MAD). A p-value corresponding to a test, where the null hypothesis is that the sample is not an outlier, can then be calculated based on the observed distance measure. No samples were identified as outliers in either ionization mode.
A total of 7 and 10 internal standards (ISs) were run in negative and positive ionization mode, respectively. Figure S5.2A & D show the log2 abundance values for each IS over all samples for the negative mode data and Figure S5.2B & E show the log2 abundance values for each IS over all samples for the positive mode data.
The coefficient of variation (CV) was calculated for each IS. For each sample, data was normalized by the median IS value of ISs, which were observed in every sample and had a CV of no more than 35 %. For the infection samples, of the 8 and 10 ISs, 6 and 6 were used in calculating normalization factors for the negative and positive mode data, respectively. For the treatment samples, three (of seven) internal standards were used in calculating normalization factors for the negative mode data, and four (of ten) ISs were used for the positive mode data.
Figure S5.2C & F show the normalized log2 abundance profiles for each sample ordered and colored by time point and infection or treatment combination, respectively.
Sequential projection pursuit principal component analysis (PCA)48 (Webb-Robertson et al. 2013), which does not require imputation of missing values, was run on the combined normalized ionization datasets. Figure 5.1B and Figure 5.4B show the first two component scores for sample colored by time point and condition, for infection and treatment samples, respectively. Timepoint is associated with the largest sources of variability in the data.
All data visualizations were completed using R.
5.6 Acknowledgements, & Contributions
5.6.1 Acknowledgements
We are grateful to Dr. David Lewinsohn at the Oregon Health & Science University and the United States Veterans Association in Portland, OR, for providing the Mtb strains H37Rv and H37Rv-ΔRD1. We also thank Dr. Branch Moody at the Harvard Department of Immunology in Cambridge, MA, for providing us with the 1-tuberculosinyladenosine used in this study.
5.6.2 Contributions
GG designed the study, performed Mtb infections and sample preparations of infection lipidomics samples for mass spectrometry analysis, prepared the data visualization and interpretation, and wrote the manuscript. SF optimized Mtb treatment concentrations, prepared treatment samples for mass spectrometry analysis, assisted in data interpretation, and edited the manuscript. MG assisted in optimizing Mtb treatment concentrations. JK & LB operated the mass spectrometer to collect the data, prepared the analysis pipeline, performed the statistical analysis, assisted in data interpretation, and edited the manuscript. FT designed and directed the study.
5.7 Supplementary figures