4 Sealing the Gaps
Sphingolipids are essential for repairing the endosomal damage caused by Mycobacterium tuberculosis
4.1 Abstract
Tuberculosis infection remains one of the leading causes of death worldwide, causing over 1.3 million deaths in 2022 alone. With the emergence of antibiotic-resistant strains of Mycobacterium tuberculosis (Mtb), there is a pressing need for novel and improved therapeutics. Here, we characterize the critical role of sphingolipids in restricting intracellular replication of Mtb. Sphingolipids are essential for rapidly responding to membrane damage and maintaining lysosomal integrity during Mtb infection. Additionally, sphingolipids enable the restriction of Mtb growth within host cells. Understanding the influence of host sphingolipids on Mtb infection may reveal novel routes for host-directed therapy. This research provides valuable insights into the pathogenesis of Mtb infection and could pave the way for developing new therapeutic strategies.
4.2 Introduction
Mycobacterium tuberculosis (Mtb) is an intracellular pathogen and remains a major global health threat, responsible for 1.3 million deaths in 2022 alone1. The increasing prevalence of antibiotic resistant strains threatens to dramatically alter the global tuberculosis landscape; accordingly, basic research into the underlying host-pathogen interactions between the Mtb bacillus and the human host has sought to uncover novel routes of host-directed antitubercular therapy. In this paradigm, manipulating the host environment may reduce permissivity to Mtb replication and serve as conjunctive to bactericidal treatment. In recent years, host lipid biology has become recognized for having an outsized role in influencing the growth and survival of Mtb within a human host cell2–4. A pivotal point in the progression of latent tuberculosis disease to active pathology is Mtb’s escape from the phagosome-derived Mtb-containing vacuole via membrane damage. Recent work has suggested that sphingolipid biology may be leveraged to increase a cell’s resistance to membrane damage and to ininfluence the repairability of a damaged organelle.
Mtb is well-known for inducing endosomal and plasma membrane damage in host cells – both of which greatly aid the bacteria in replication and immune subversion5–8. The small proteins ESAT-6 and CFP-10 are the two most immunodominant Mtb antigens among of the most well-studied bacterial pore-forming proteins. Part of the WXG100 superfamily, ESAT-6 and CFP-10 form heterodimeric membrane-spanning pores9. Recent work by ourselves and others has shown that the membrane interaction and dimerization of ESAT-6 and CFP-10 are triggered by the partially acidic environment of the maturing endosome10,11. In conjunction with ESAT-6 and CFP-10, Mtb produces glycolipids, such as phthiocerol dimycocerosate (PDIM), which participate in membrane disruption12–14. Augenstreich et al. and others have shown that PDIM is shed from the bacterial cell wall and inserts into host membranes, significantly contributing to endosomal escape in a cholesterol-dependent manner15. Loss of these membrane-damaging pathogenicity factors results in a substantial attenuation of previously-pathogenic mycobacterial strains16.
Endo/lysosomal membrane damage during infection is a significant risk to host cell survival. The low pH, high concentration of Ca2+, and hydrolases (including proteases, lipases, and glycosidases) each pose lethal challenges to the cell; further, the dissolution of these antimicrobial factors prevents the destruction of pathogenic invaders12. Therefore, the cell employs several independent and redundant repair mechanisms that act in sequence to maintain endo/lysosomal integrity and homeostasis. The most well-studied of these mechanisms is the ESCRT pathway, which consists of several distinct heteromeric complexes17. In the ESCRT pathway, several sequestosome-like receptors, such as the Galectins, serve as cytosolic sensors of endo/lysosomal membrane damage, in which the exposure of the glycocalyx results in the deposition of these sensors at the site of damage and induces the recruitment of ESCRT machinery18. The ESCRT-III complex accumulates at the site of membrane damage and is directly responsible for membrane remodeling: the polymerized subunits of charged multivesicular body proteins (CHMPs 6, 4a, 4b, 4c, 3, 2b, 2c, and 1b) bind to the membrane and induce curvature and eventual scission of the damaged membrane region17. Several lipids play essential roles in the rapid repair of membrane damage. For example, Tan et al. and Radulovic et al. showed in 2022 that the coordination of lipid delivery to damaged membranes is necessary for membrane repair19,20. These studies each demonstrated that the phosphatidylinositol-4 kinase type 2α (PIK2A) is required for the rapid repair of membranes and promotes the formation of ER contact sites that enable the transfer of lipid content (primarily phosphatidylserine and cholesterol) to the damaged organelle19,20. Intriguingly, prior reports have suggested the existence of an ESCRT-independent, sphingolipid-dependent membrane repair mechanism21–23 – though the underlying mechanisms of this process are not yet fully clarified.
In the current study, we sought to understand host sphingolipids’ role during an intracellular Mycobacterium tuberculosis infection. Given the known roles of lipids during the restoration of endo/lysosomal homeostasis after damage, we hypothesized that host sphingolipids may play an essential role in the cellular response to the membrane damage induced by Mtb during infection. We found that cells deficient in sphingolipid synthesis display more Mtb-induced membrane damage at earlier times. We further validate that sphingolipids both protect cells from lysosomal damage and enable membrane repair. We then show that sphingomyelin accumulates at the sites of membrane damage following damage induced by both LLOME and Mtb. Moreover, we finally show that the de novo synthesis of sphingolipids is essential in restricting the intracellular growth of Mtb. The sphingolipid pathway may represent a novel route of antitubercular therapy. Because these lipids appear to play an outsized role in restricting the intracellular growth of pathogenic Mtb, their synthesis may be leveraged in TB patients as an adjunctive to frontline antibiotics.
4.3 Results
4.3.1 Manipulating the sphingolipid metabolic pathway
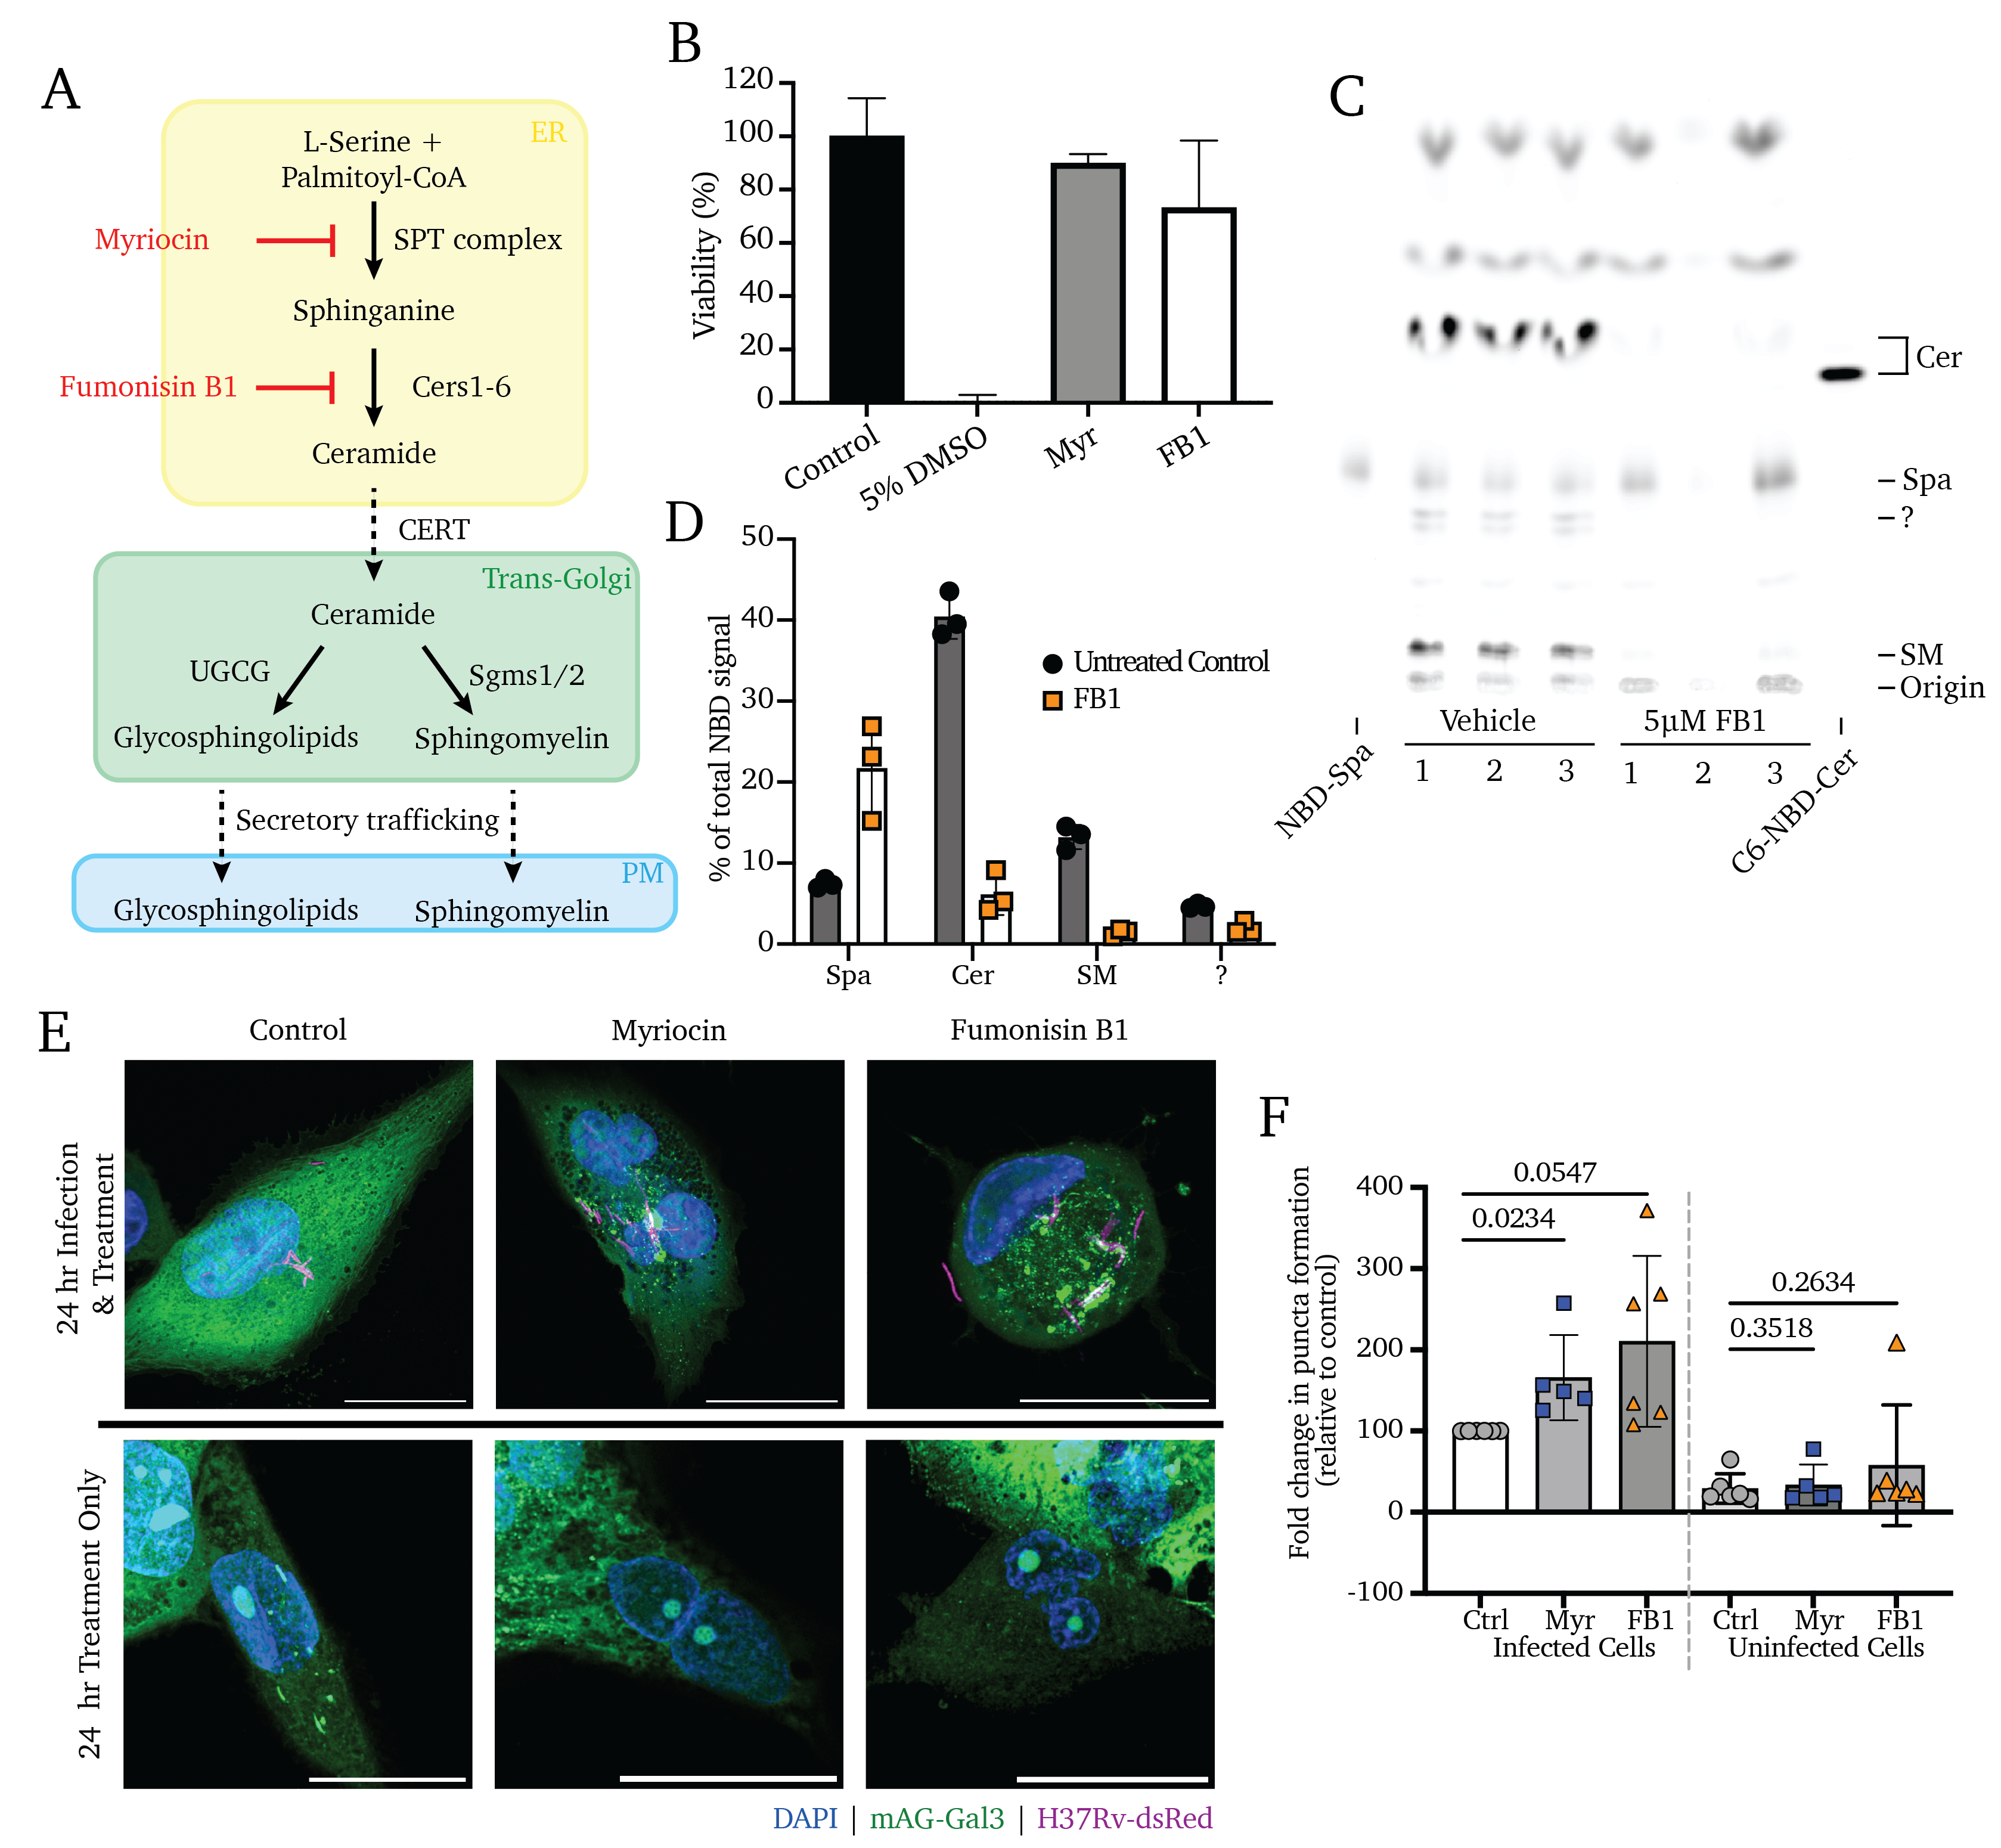
Figure 4.1A depicts a simplified schematic of the sphingolipid biosynthetic cascade. Briefly, sphingolipid production begins with the sphingoid base in the ER through the condensation of serine and palmitoyl-CoA by the serine-palmitoyl transferase (SPT) enzyme. Still in the ER, the sphingoid base is converted to ceramide by a cohort of ceramide synthase enzymes (Cers1-6), which append secondary acyl chains of varying lengths. Ceramide represents a central nexus of sphingolipid metabolism; it is itself a potently active signaling molecule whose excess stimulates apoptosis24–28. In concert with its production, ceramide is rapidly transferred to the trans-Golgi via the Ceramide Transport Protein (CERT) and is primarily (>80%) converted to sphingomyelin (SM) by SM Synthase 1 (SMS1)29. SM is selectively trafficked towards the outer leaflet of the plasma membrane via sorting in the trans-Golgi network and export via the secretory pathway30,31. Other than the pool of sphingolipids undergoing active synthesis and trafficking, the most significant glut of intracellular sphingolipids is in the endosomal compartment, accumulated via the internalization and recycling of plasma membrane SM via endocytosis and phagocytosis, a process commonly referred to as the “salvage” pathway21,32,33.
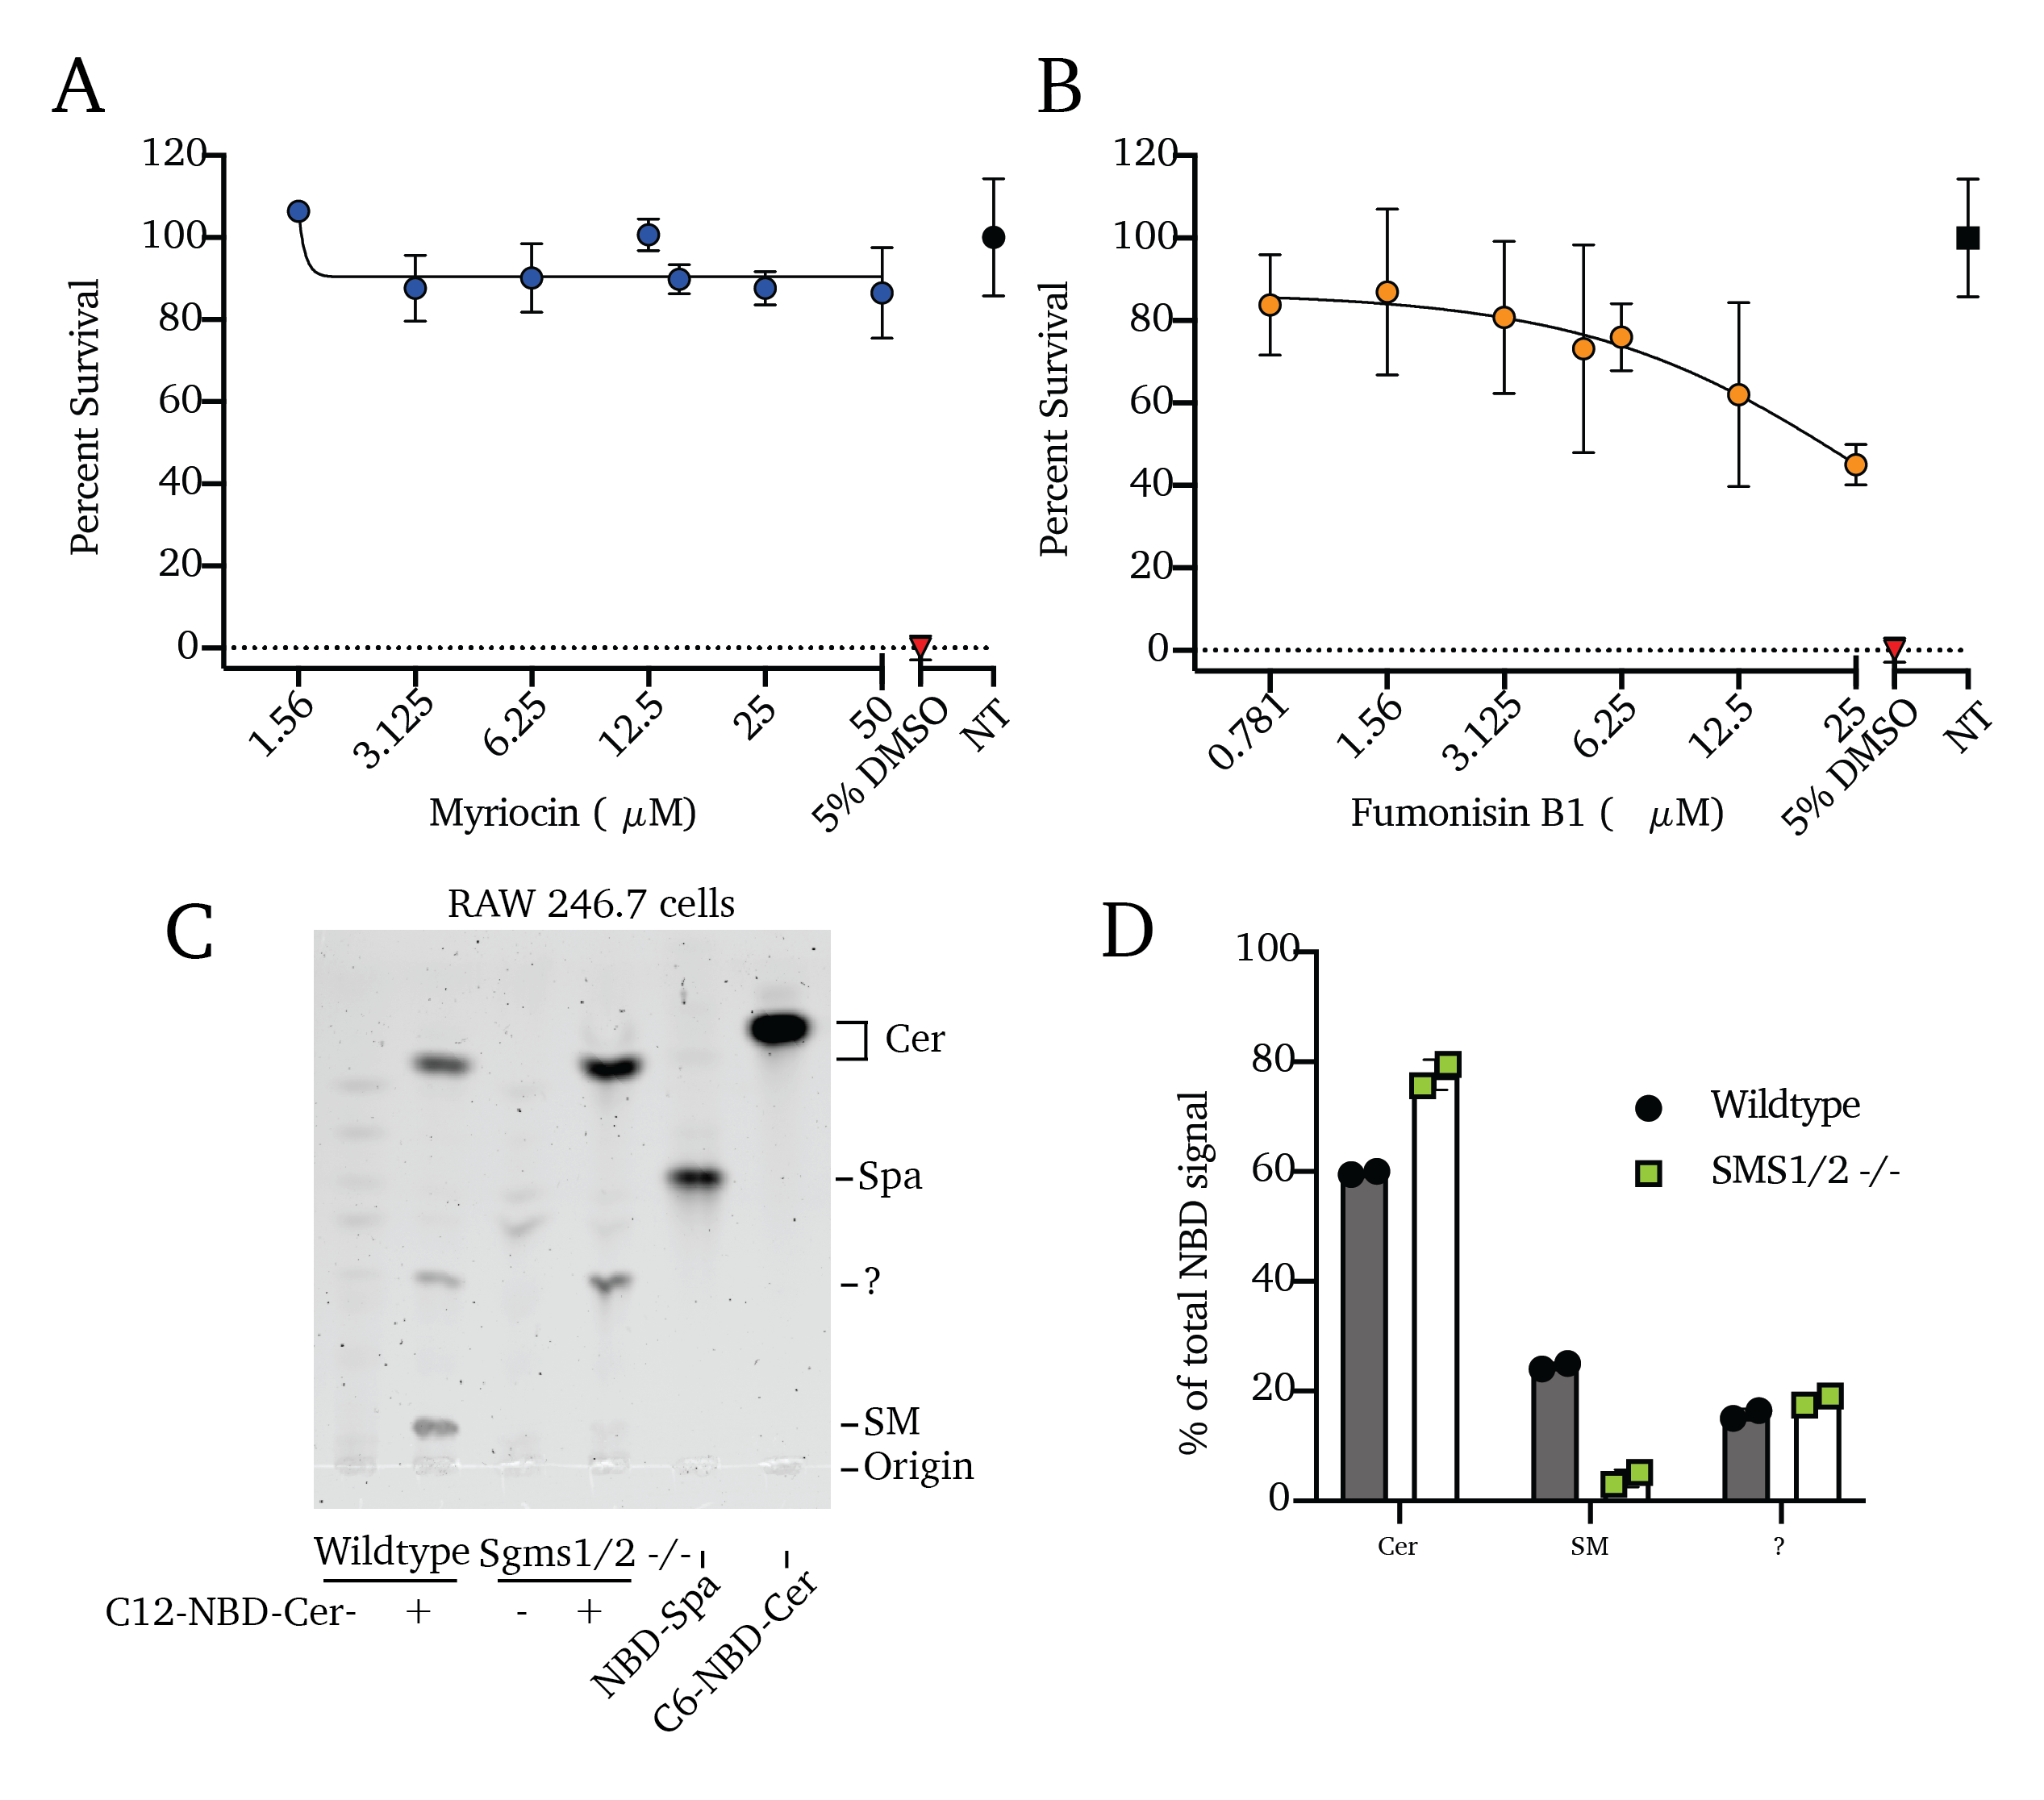
Small molecule inhibitors such as myriocin (Myr) and fumonisin B1 (FB1) enable the near-total blockade of sphingolipid production34–40. In our prior work, we showed that Myr treatment or genetic deletion of Sptlc2 (the catalytic subunit of the SPT complex) are both sufficient to block the de novo production of all higher sphingolipids by blocking the activity of SPT, the rate-limiting step in the sphingolipid pathway (Figure 4.1A)41. Similarly, treatment with the compound FB1 blocks the ceramide production by the ceramide synthases, blocking all higher sphingolipid synthesis41,42. We selected treatment concentrations of Myr and FB1 for this study based on their cytotoxicity, settling on concentrations that we and others have previously used (Figure 4.1C and Figure S4.1A and B)37,41,43.
To validate the effectiveness of FB1, we exposed cells pre-treated with FB1 to fluorescent NBD-sphinganine to trace its conversion to ceramide or SM, as visualized via fluorescent thin-layer chromatography (TLC; Figure 4.1C and D). These data show that 3-day FB1 treatments are sufficient to block de novo sphingolipid synthesis, significantly reducing total sphingolipid content in these cells, including an 84% reduction of ceramide production, 89% reduction of SM production, and retention of the NBD-sphinganine input (192% more NBD-sphinganine than untreated control cells; Figure 4.1C and D). These findings agree with our previous work41. Our previous lipidomics analysis additionally showed that the total content of bulk lipids is unaffected and that total protein synthesis is unaffected following these treatments41. As a genetic means of inhibiting sphingolipid production, we utilized RAW 264.7 murine macrophages of wildtype, Sptlc2-/-, and Sgms1/2-/- genetic backgrounds, as reported in our previous work23,41. We similarly validated the reduction in higher sphingolipid production in Sgms1/2-/- cells using a 1-hour treatment with NBD-ceramide and fluorescent TLC; we found an 83% reduction of conversion of NBD-ceramide into NBD-sphingomyelin (Figure S4.1D and F). As with FB1 treatment, Sgms1/2 double knockout cells retain a higher proportion of the NBD-ceramide input (Figure S4.1C and D). As above, the inhibiting effects of myriocin treatment and SPT knockout were validated in our previous reports37,41.
Using these genetic models and small-molecule inhibitors, we sought to address sphingolipids’ roles in the intracellular stage of an Mtb infection.
4.3.2 Host sphingolipids protect against Mtb-induced endosomal membrane damage.
Galectins 3, 5, and 8 are all recruited to the Mtb-containing endosome, and Galectins 5 and 8 both play essential roles in restricting Mtb growth in the cell. However, Galectin 3 (Gal3) was shown not to affect Mtb growth and represents a vital tool in visualizing membrane damage accumulation during Mtb infection. Here, we overexpressed a previously reported fluorescent fusion construct of Galectin 3 and mAzamiGreen (mAG-Gal3) in macrophages as a reporter of endosomal membrane damage44.
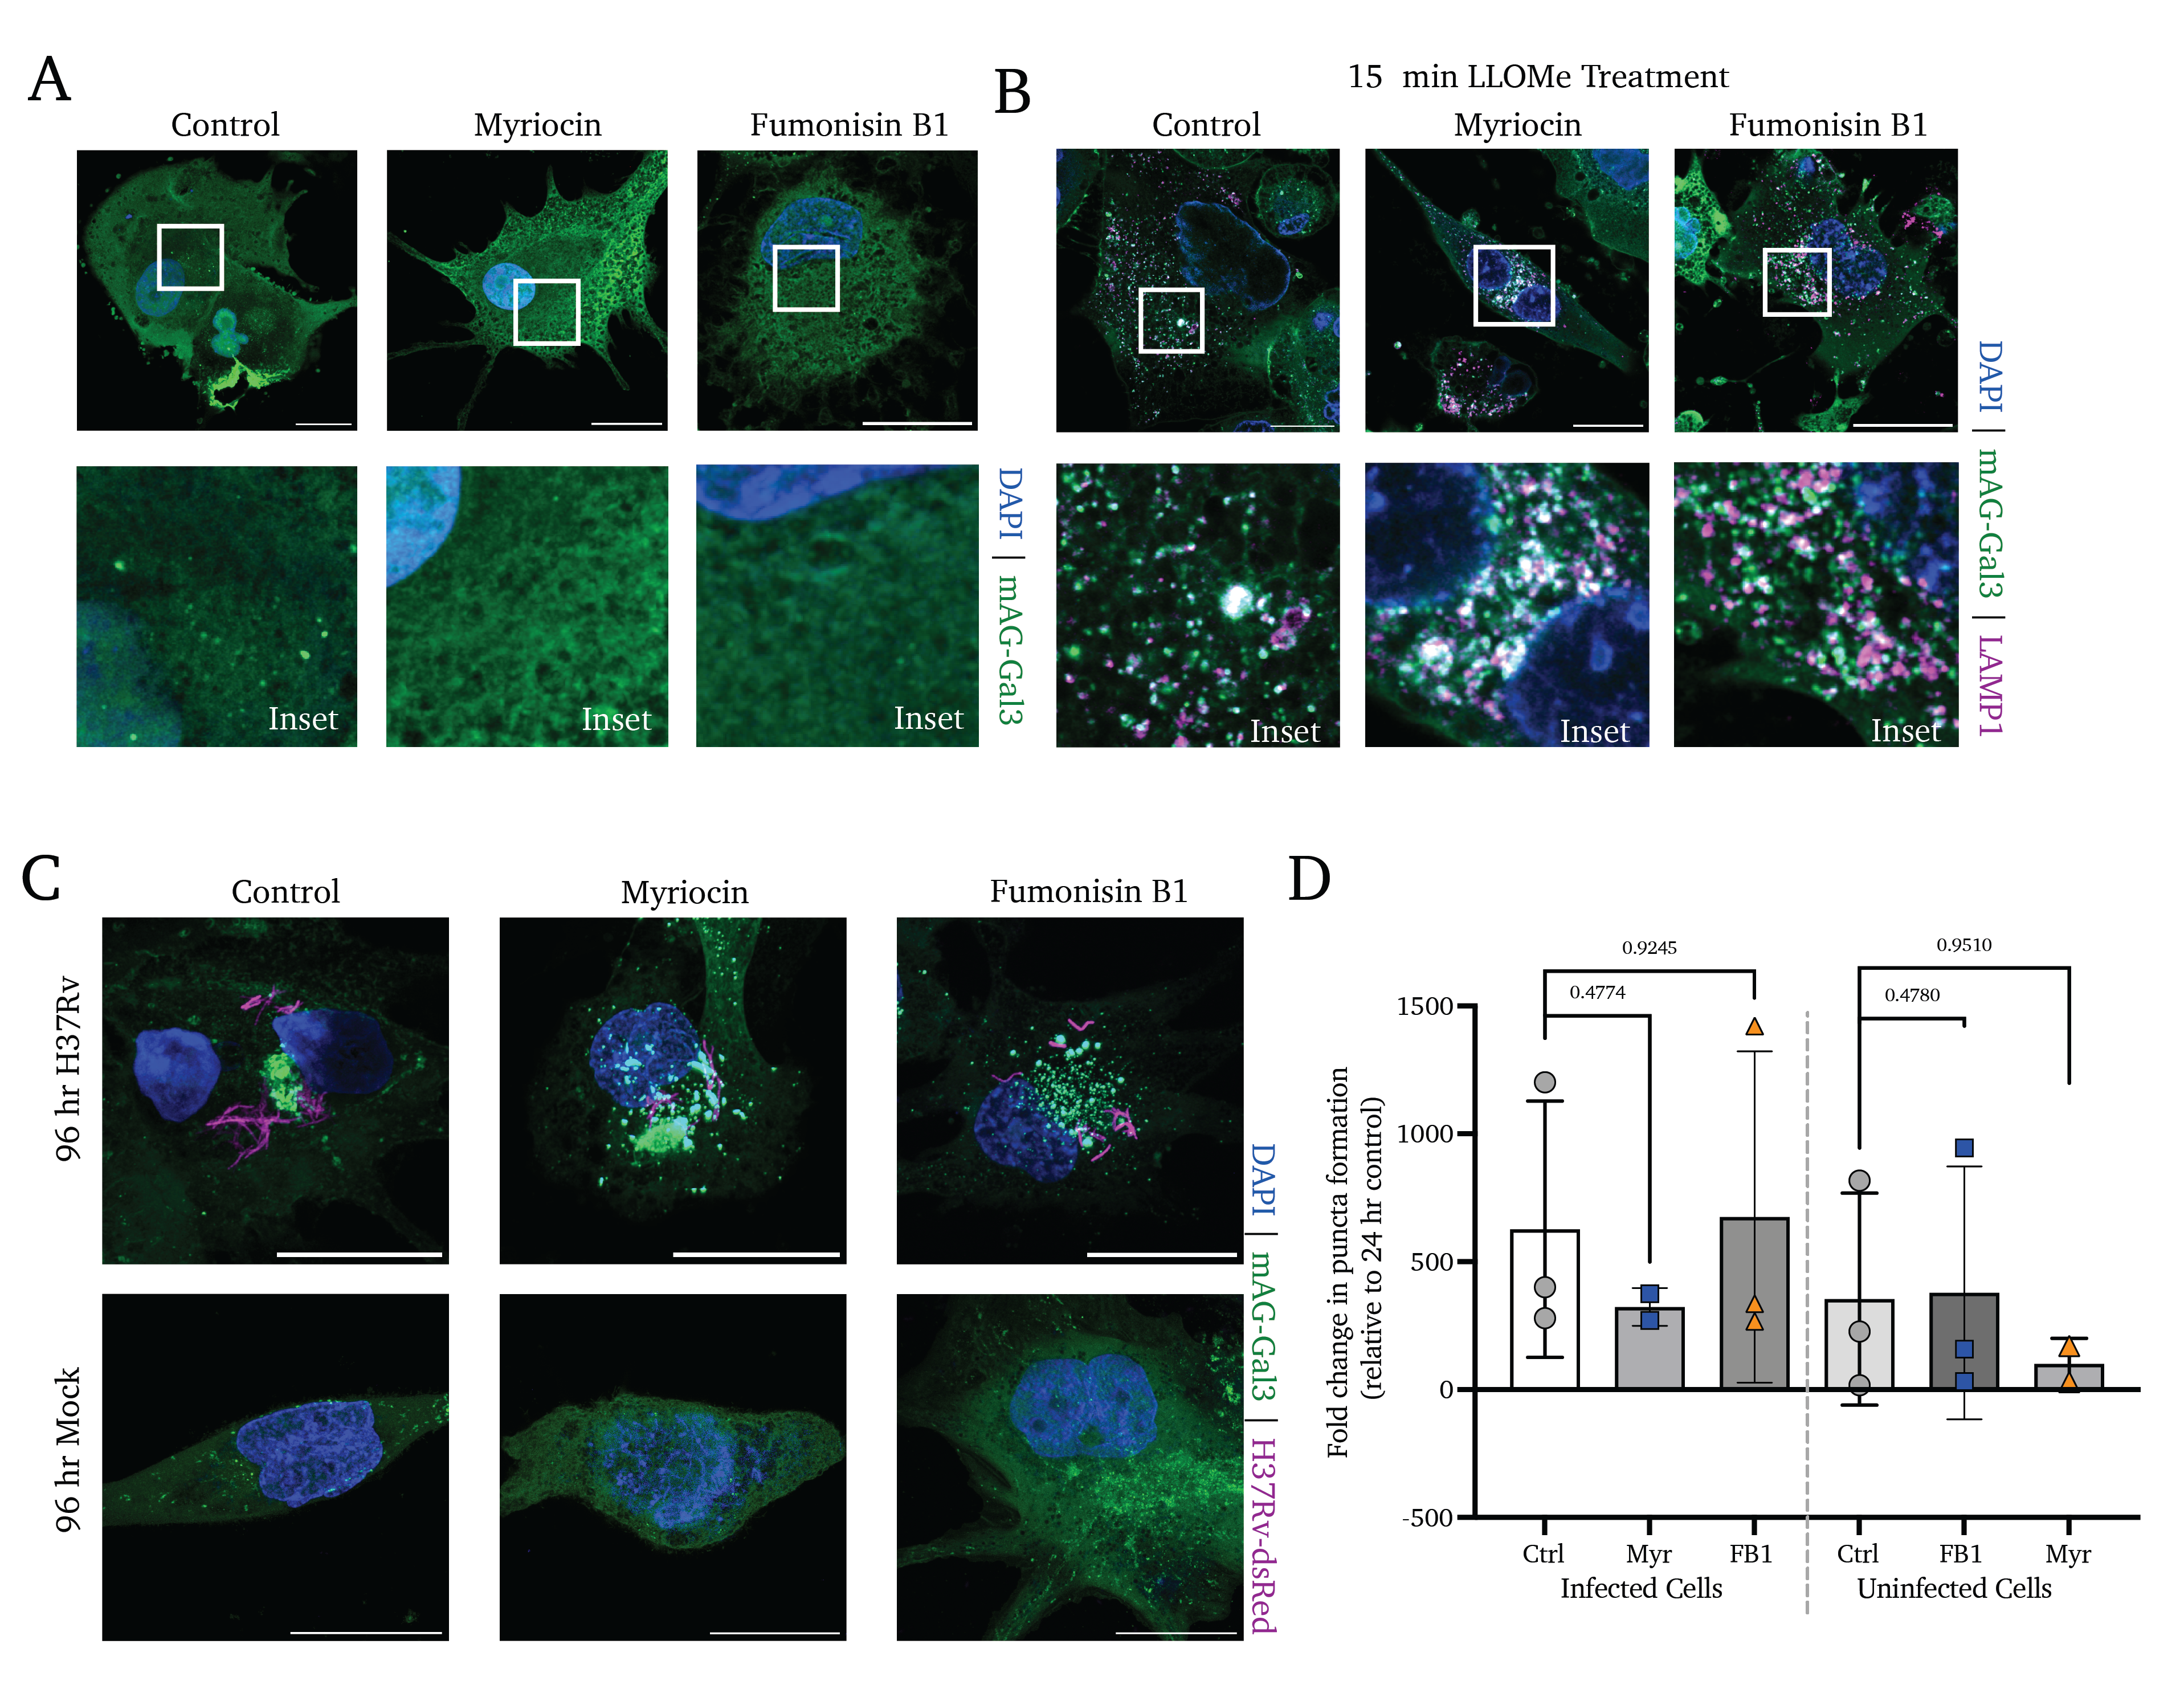
Because we have previously reported that sphingolipids are required for Mtb’s entry into the host cell via phagocytosis, we performed infections in the absence of sphingolipid inhibition to allow for uniform Mtb infection with the fluorescent Mtb strain H37Rv-dsRed. After 4 hours of uptake time, non-internalized bacteria were removed via PBS wash, and cells were cultured in media with Myr, FB1, or vehicle control for 24 or 96 hours and visualized using confocal microscopy(Figure 4.1D).
We observe a significant accumulation of colocalized mAG-Gal3 punctate signal and H37Rv-dsRed (reflective of Mtb-induced endosomal membrane damage) at 24 hours post-treatment in Myr- and FB1-treated cells. In contrast, untreated control cells display a marked absence of Gal3 puncta (Figure 4.1D, upper and middle panels). Notably, treated-but-uninfected bystander cells display no change in Gal3 accumulation (Figure 4.1D, lower panels). In quantifying high-content images of these infections, we observe a significant increase in the rate of membrane damage at 24 hours post-infection (Figure 4.1D). Notably, by 96 hours of treatment, all infected cells display Gal3 puncta accumulation to a high and similar degree, regardless of treatment (Figure S4.2D and E).
These data show that Mtb-induced membrane damage is significantly mitigated by host sphingolipid production. However, these data do not indicate whether this is a result of increased sensitivity to membrane damage or whether membrane damage accumulates as a result of impaired membrane repair, a question explored below.
4.3.3 Sphingolipids protect cells from endo/lysosomal damage before the ESCRT repair pathway activation.
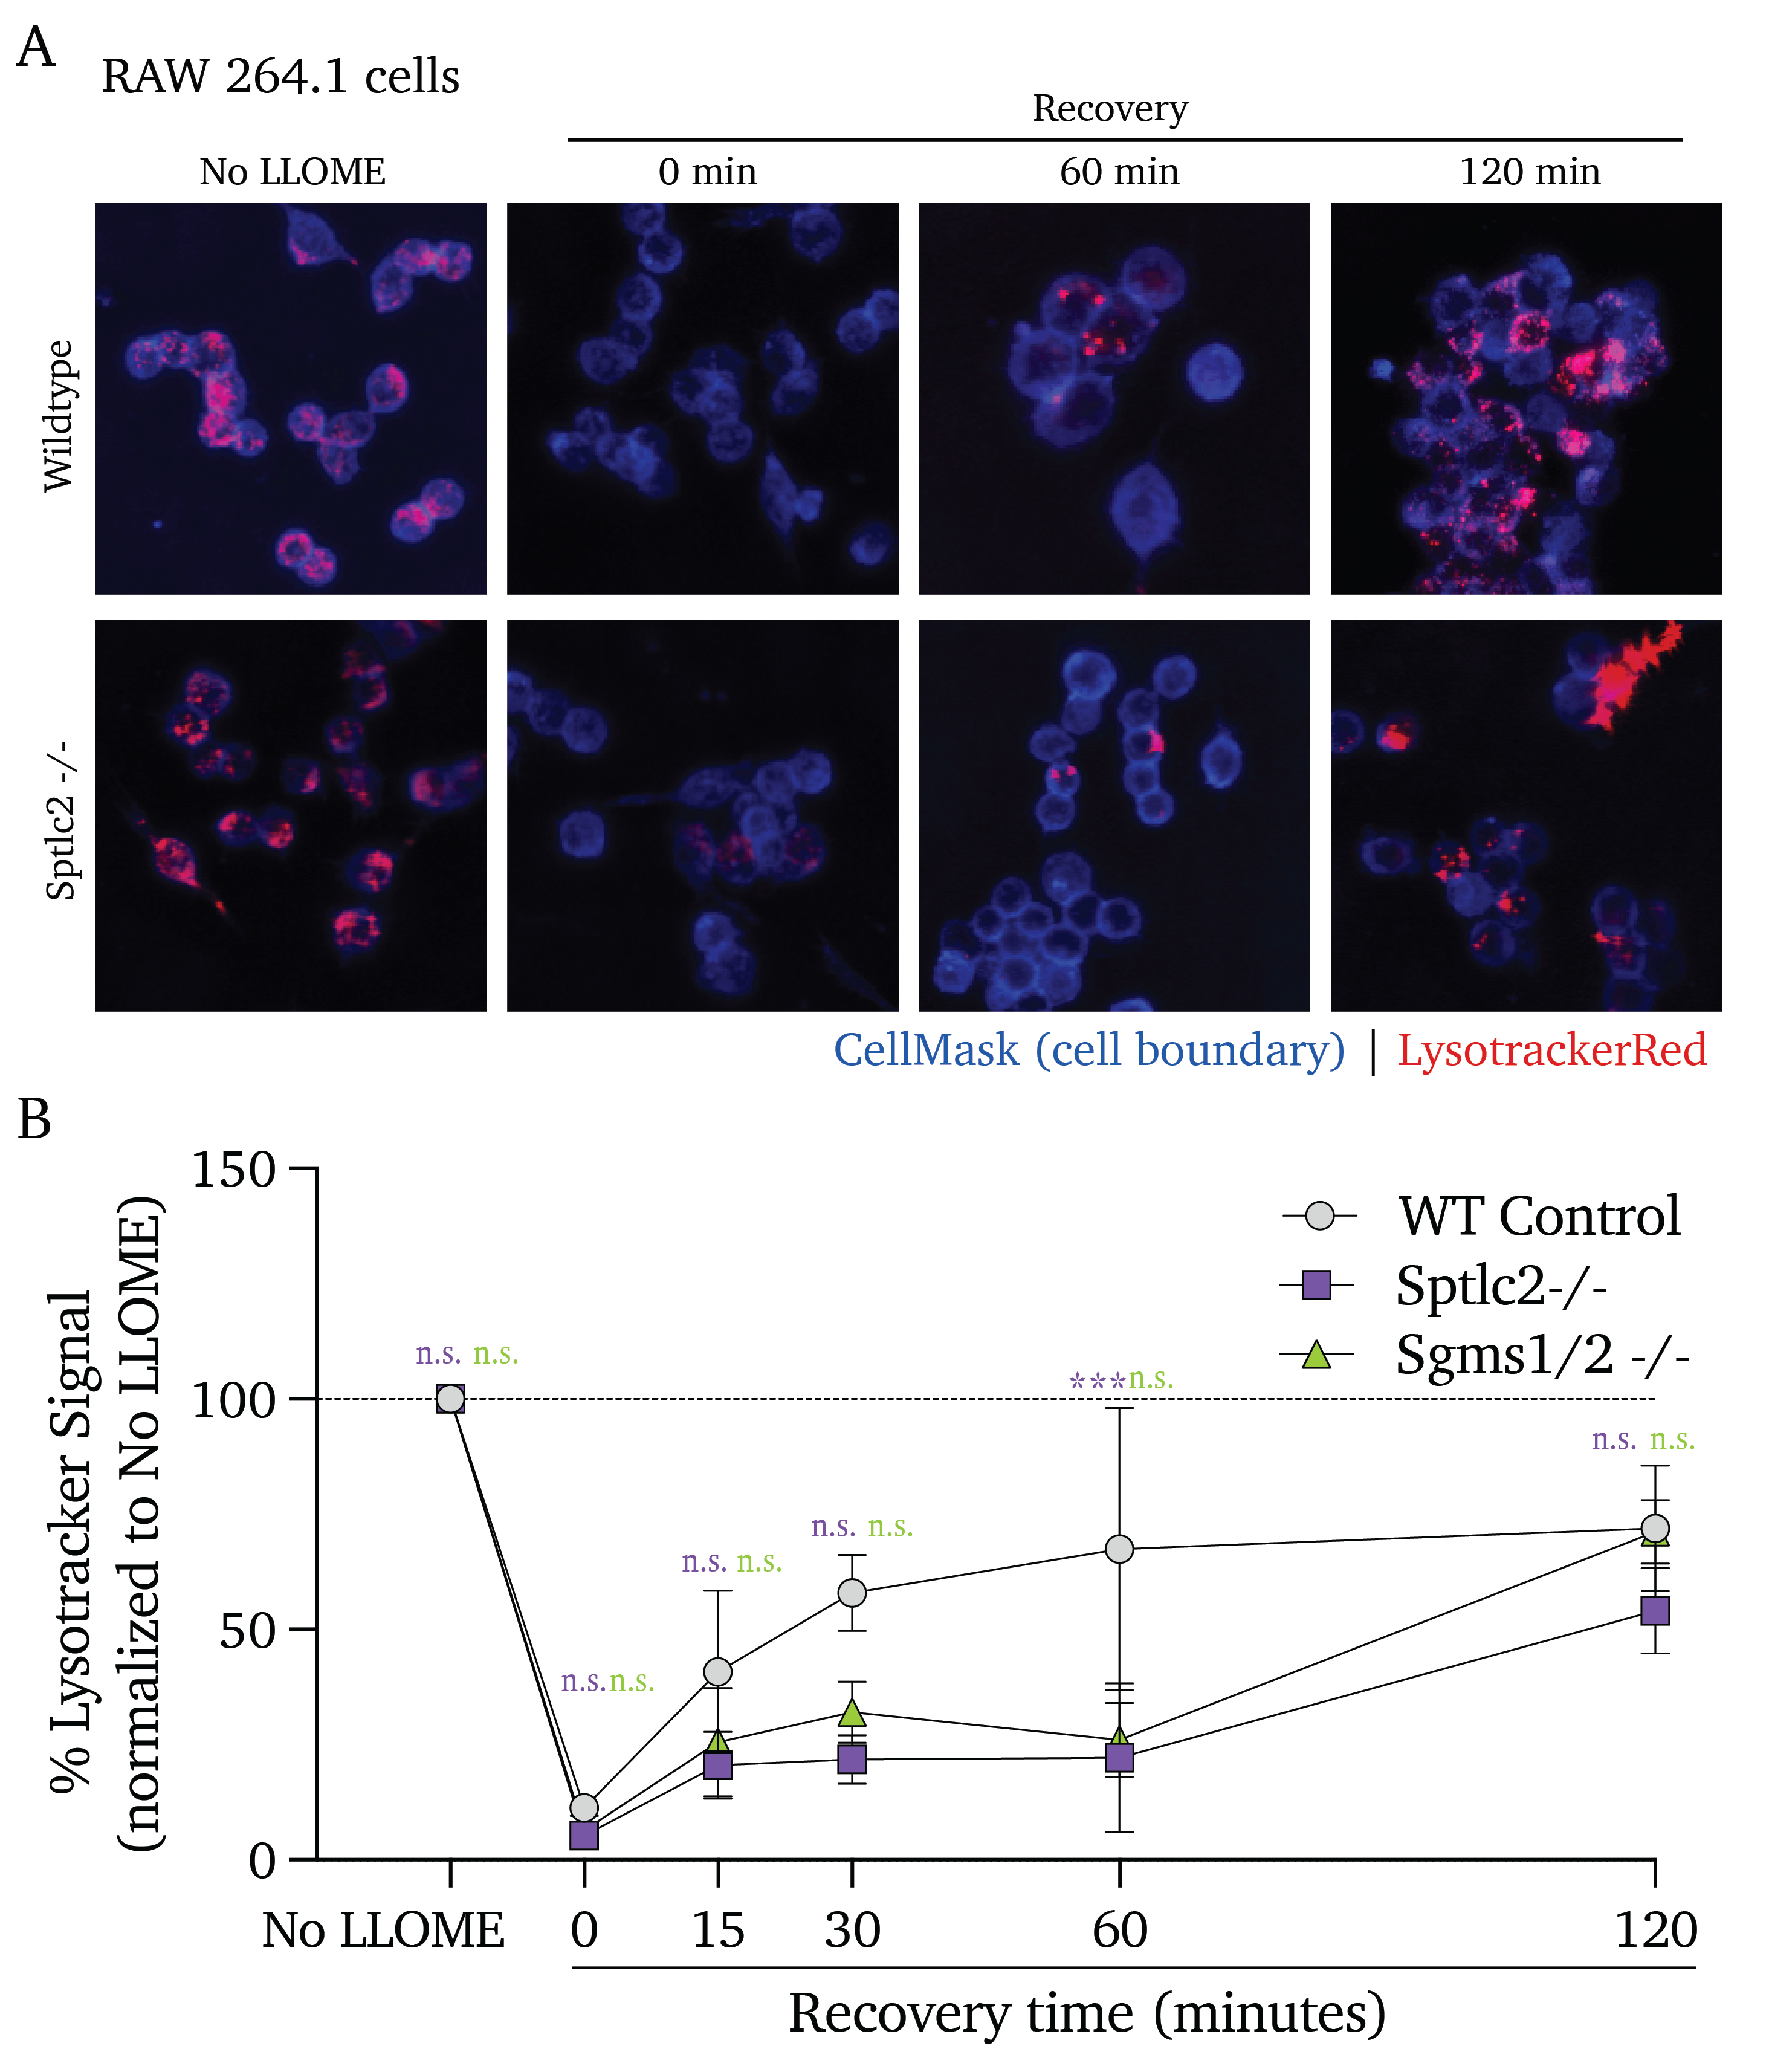
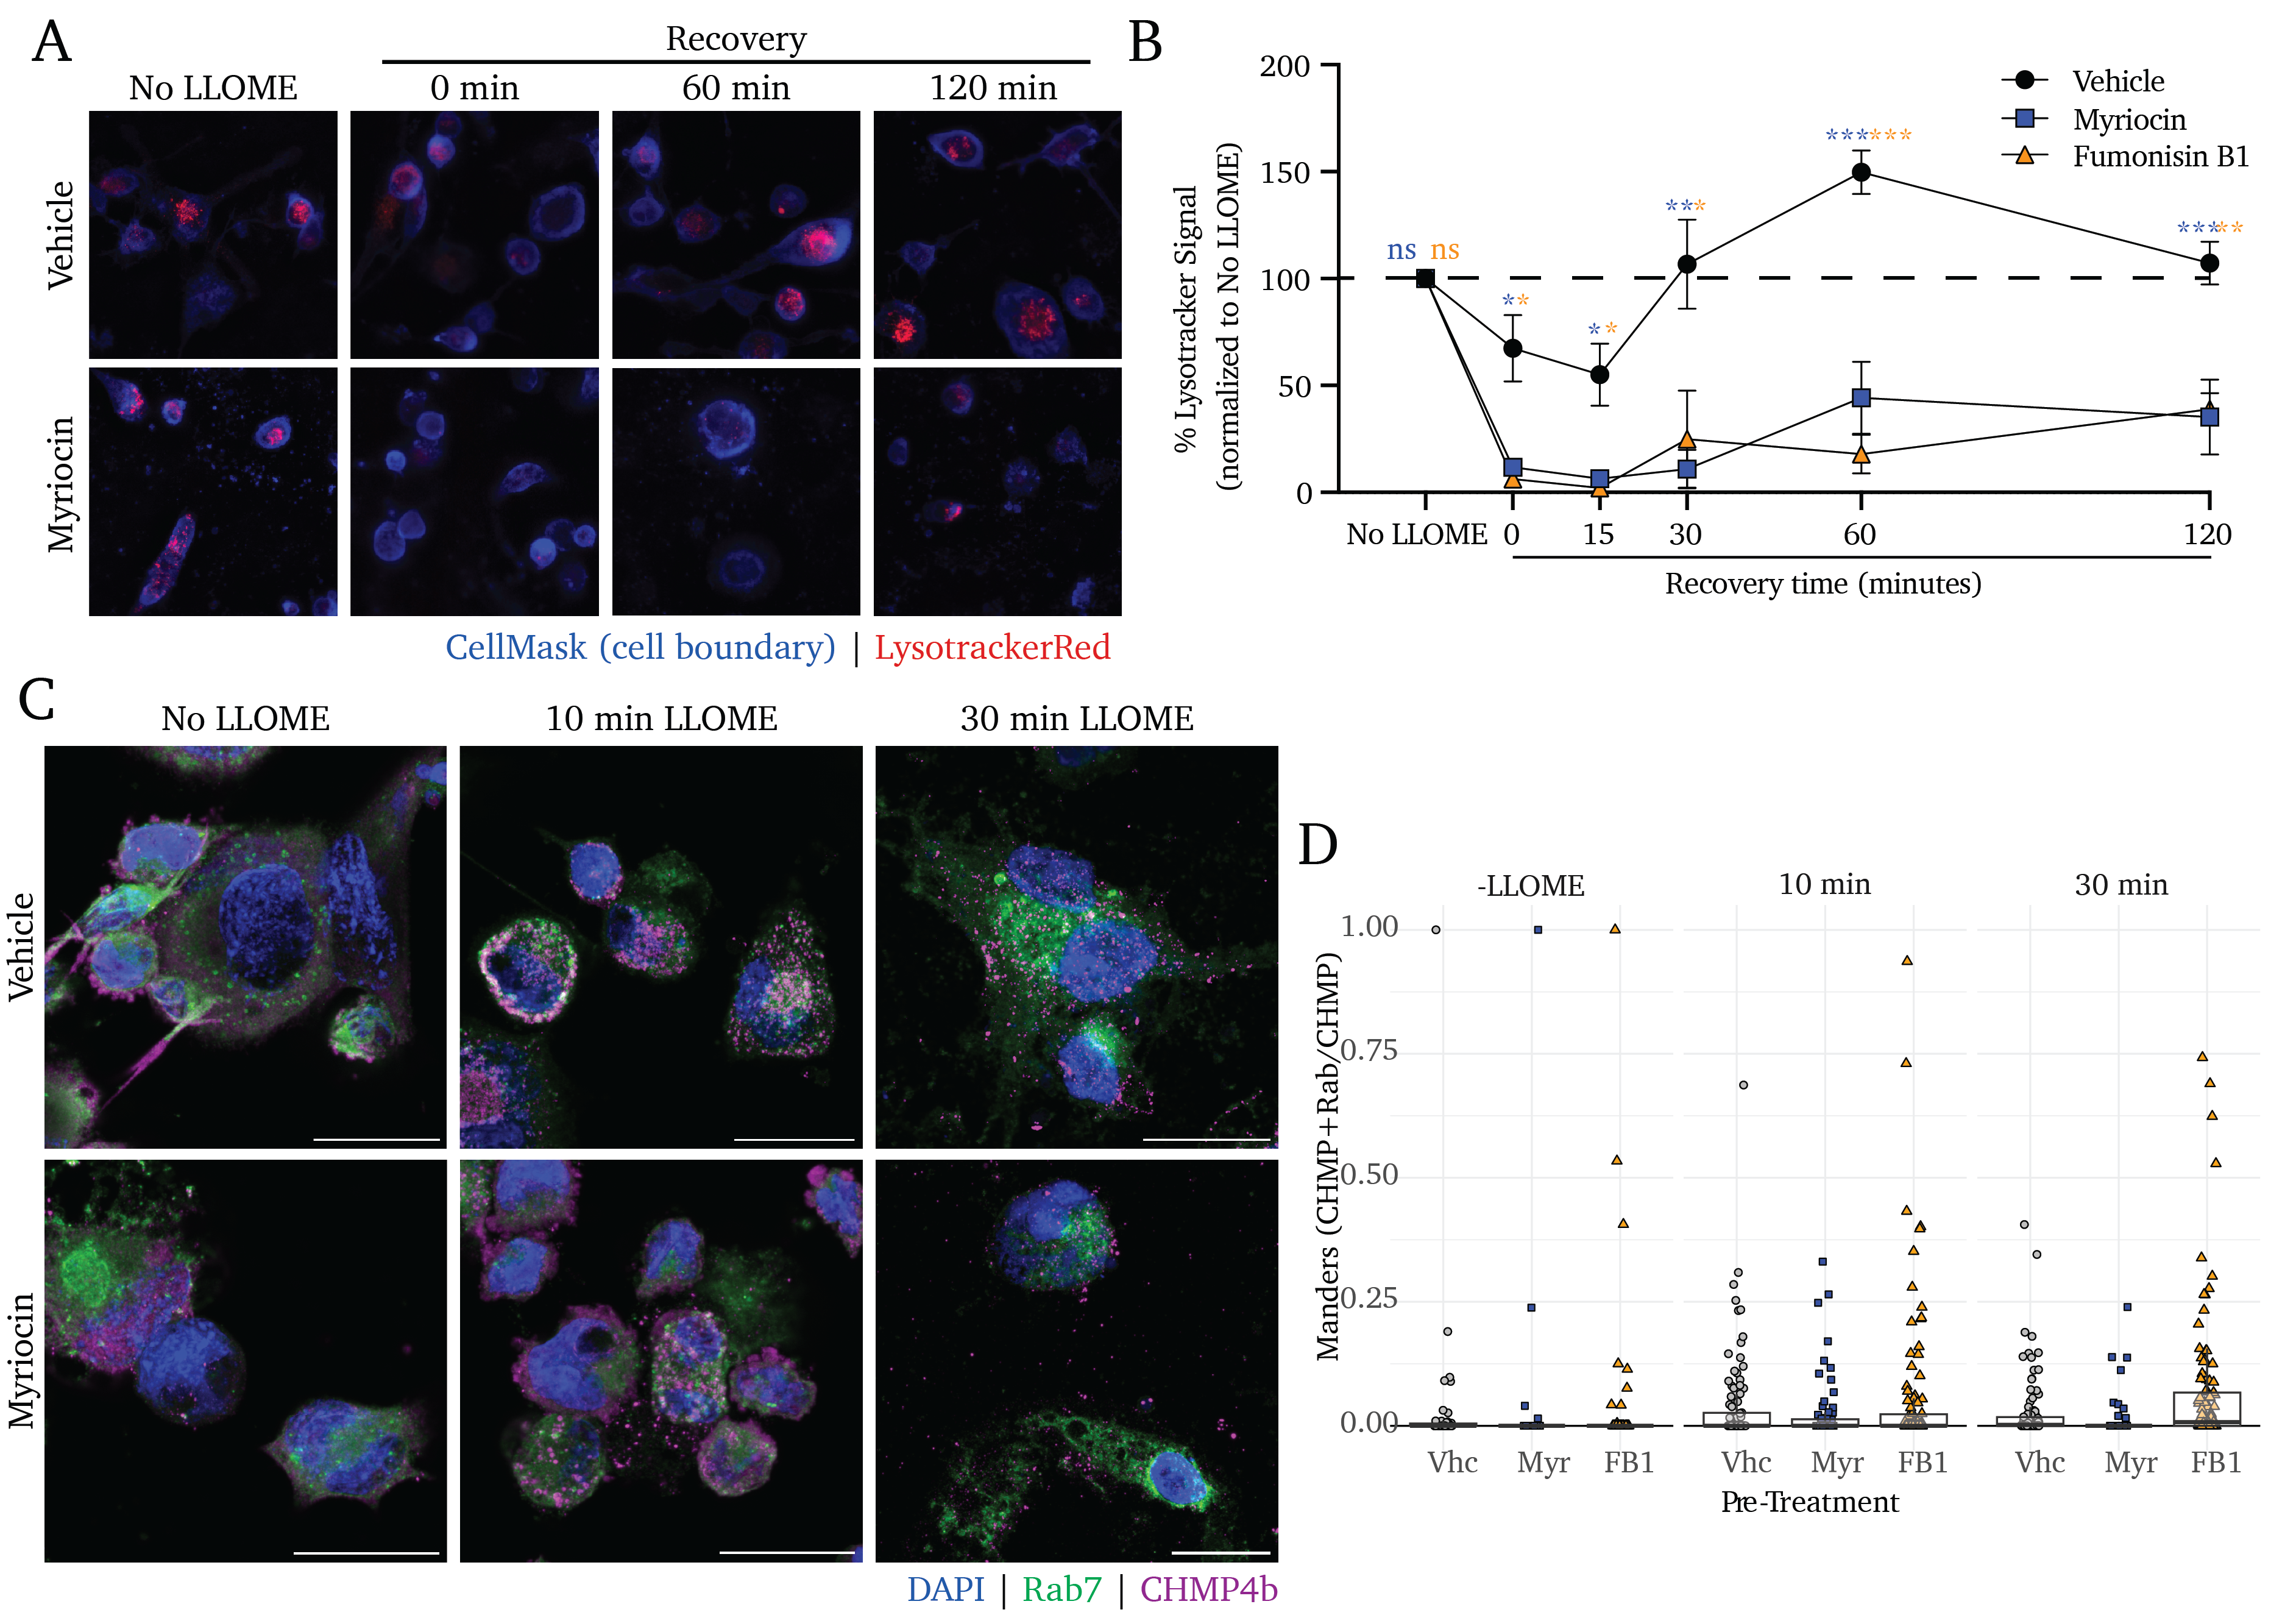
To clarify whether sphingolipid-deficient cells are more sensitive to membrane damage or whether these cells fail to repair endo/lysosomal membrane damage, we performed a recovery assay in which cells were exposed to a lysosomotropic membrane-damaging agent, leucine-leucine methyl ester (LLOME) and given increasing recovery periods. LLOME is a dipeptide that accumulates in the lysosome and is cleaved by a resident lysosome-resident dipeptidyl peptidase, DPP1, to release a membranolytic product45. To visualize intact lysosomes, we stained cells with Lysotracker, an agent with acidity-activated fluorogenicity.
In untreated control cells, we see that 15-minute LLOME treatment induces a loss of lysotracker fluorescence (indicative of reduced lysosomal integrity) that rebounds within 60 minutes of recovery and settles at the initial baseline fluorescence by 120 minutes of recovery (Figure 4.2A and B, black points). In contrast, cells pre-treated with Myr or FB1 experience a significant loss of lysosomal acidity and fail to recover to pre-LLOME levels of lysotracker signal (Figure 4.2A and B, blue and orange points, respectively).
Notably, Myr and FB1 pre-treatments significantly decrease lysotracker signal with 0 minutes of recovery time; these results indicate that sphingolipid inhibition results in an enhanced sensitivity to endo/lysosomal membrane damage. Similarly, while we observe a rebound effect in the sphingolipid-producing control cells, no such rebound is apparent in the Myr and FB1 pre-treated cells; this indicates impaired recovery from lysosomal damage in addition to the enhanced sensitivity to damage.
We next sought to clarify whether the inhibition of sphingolipid production incurs a defect in ESCRT-III assembly at the sites of membrane damage using fluorescence microscopy. While Gal3/ESCRT accumulation on an organelle induces autophagy at long time points, in the short term this pathway primarily enables the repair of damaged membranes17,46. Intriguingly, Mittal et al. showed in 2018 that the secreted Mtb effectors EsxG and EsxH directly interfere with the activity of the ESCRT membrane damage response pathway, inhibiting the cell’s capacity to mitigate phago/lysosomal membrane damage47. The work by Mittal et al. do not explore the role of lipids in this counterbalanced interplay between the pathogen and the host. Thus, we sought to better understand whether sphingolipids are involved in the ESCRT response in the absence of these Mtb mechanisms of ESCRT interference, we visualized the accumulation of one ESCRT-III protein, CHMP4b, as a proxy for ESCRT-III polymerization in sphingolipid-deficient cells (Figure 4.2C). We find that cells treated with vehicle control display the formation of CHMP4b puncta after 10 minutes of treatment with LLOME, and a peak of CHMP4b punctate signal at 30 minutes (Figure 4.2C, upper panels). Intriguingly, pretreatment with either Myr or FB1 results in a strikingly similar degree of puncta accumulation (Figure 4.2C, lower panels). We quantified the number of puncta formed per cell in vehicle- or Myr/FB1-treated cells and found that sphingolipid inhibition appears to play no significant role in the assembly of the ESCRT-III complex (Figure 4.2D).
These data suggest that sphingolipids are crucial for the cell resisting endo/lysosomal membrane damage and restoring lysosomal homeostasis following damage – but that these lipids are dispensable for the ESCRT-mediated cellular response to damage. These results serve to partially recapitulate the reported findings of Niekamp et al., 202223 – though much more work is required to uncover the nuanced roles that these lipids play in the minutes following membrane damage.
4.3.4 Sphingomyelin accumulates at the sites of Mtb-induced membrane damage.
3 paragraphs
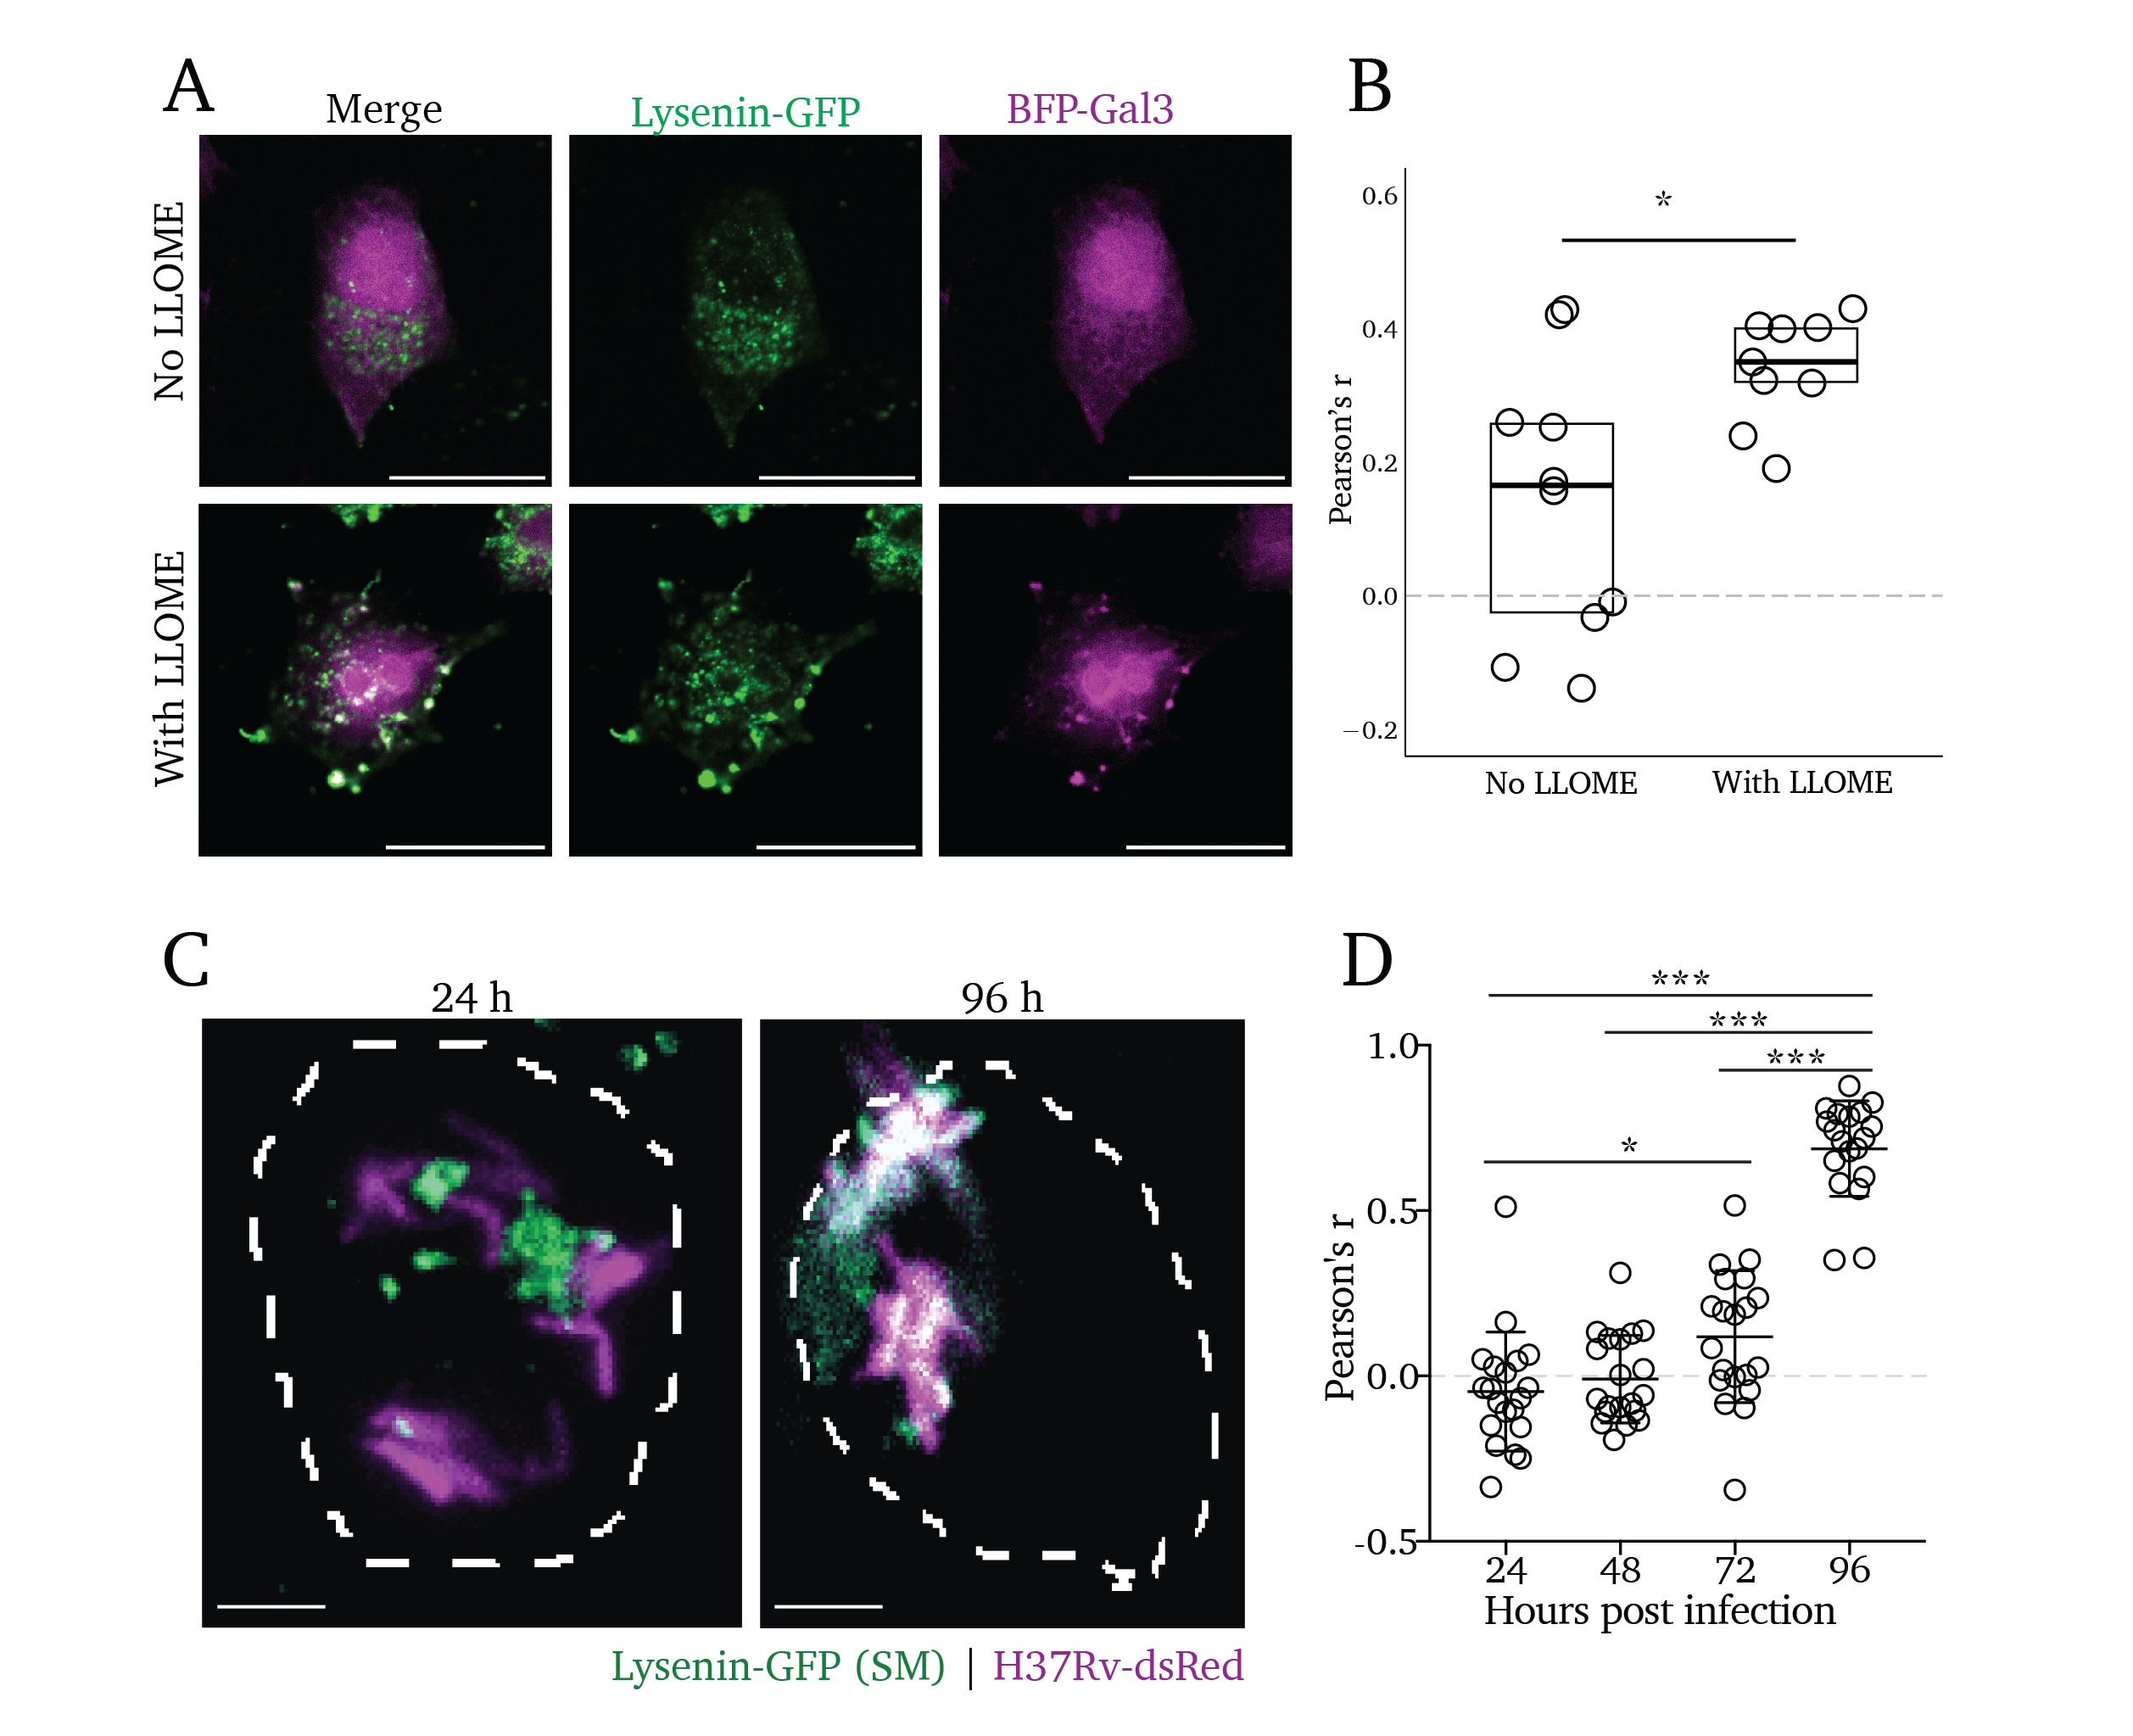
Though intuitive, the observation that lipid trafficking and metabolism are central to membrane repair has only been described in recent years. Tan et al. reported in 2022 that phosphatidylinosotide-4-phosphate kinase activty by PIK2A is essential to coordinate rapid membrane repair through the initiation of ER contact sites and transfer of phospholipids to the damaged organelle19. Also in 2022, Radulovic et al. showed that cholesterol delivery to damaged organelles is essential for membrane repair20. However, no prior reports have explored the delivery of sphingolipids to sites of membrane damage. We sought to clarify whether SM similarly accumulates at sites of organelle damage. The pore-forming toxin Lysenin was derived from the earthworm Eisenia foetida and has been widely used as a tool to visualize the cellular distribution of sphingomyelin in a cell when expressed as a modified, non-toxic fluorescent fusion protein, Lysenin-GFP29,48,49. While ectopic expression of this construct may be used as a cytosolic reporter of SM exposure, we employed it here as a staining reagent to visualize the intracellular distribution of SM after membrane damage in fixed cells.
To this end, we treated cells with LLOME for 15 minutes and visualized the localization of intracellular SM after fixation by staining the cells with purified Lysenin-GFP (Figure 4.3A). We find that there is a robust colocalization of BFP-Gal3 with Lysenin-GFP punctate signal, with an average Pearson’s colocalization coefficient of 0.350 among nine images across three biological replicates (Figure 4.3B, right). In contrast, the untreated control cells display diffuse Lysenin-GFP and a wide spread of colocalization coefficients, averaging at 0.165 among ten images across three biological replicates (Figure 4.3B, bottom images). Analysis using an unpaired t-test reveals a statistically significant increase in Lysenin-GFP colocalization in cells pre-treated with LLOME (Figure 4.3B, right; p<0.05),
Given our findings above, we hypothesized that Mtb infection would induce accumulation of SM at the site of Mtb in infected cells. Thus, we infected cells with H37Rv-dsRed for 24, 48, 72, and 96 hours and stained them with Lysenin-GFP. We find that Lysenin-GFP colocalizes with Mtb in infected cells, increasing over time and reaching a peak at 96 hours post-infection (Figure 4.3C). We quantified the rate of colocalization between Lysenin-GFP and dsRed at each timepoint and found increasing rates of colocalization via Pearson’s colocalization analysis (Figure 4.3D). Using a multiple-comparisons t-test, we found a statistically significant increase in colocalization starting at 72 hours post-infection (p<0.05), which dramatically increases by 96 hours (p<0.001). From these data, we conclude that cytosolic exposure of SM occurs concomitantly with the membrane damage that Mtb induces (as many sphingolipid-competent cells display membrane damage by 96 hours of infection, seen in Figure S4.2C and D). These findings suggest the activity of a sphingomyelin-dependent membrane repair process that plays a critical role in mitigating membrane damage during Mtb infection.
4.3.5 Sphingolipids restrict intracellular Mtb replication.
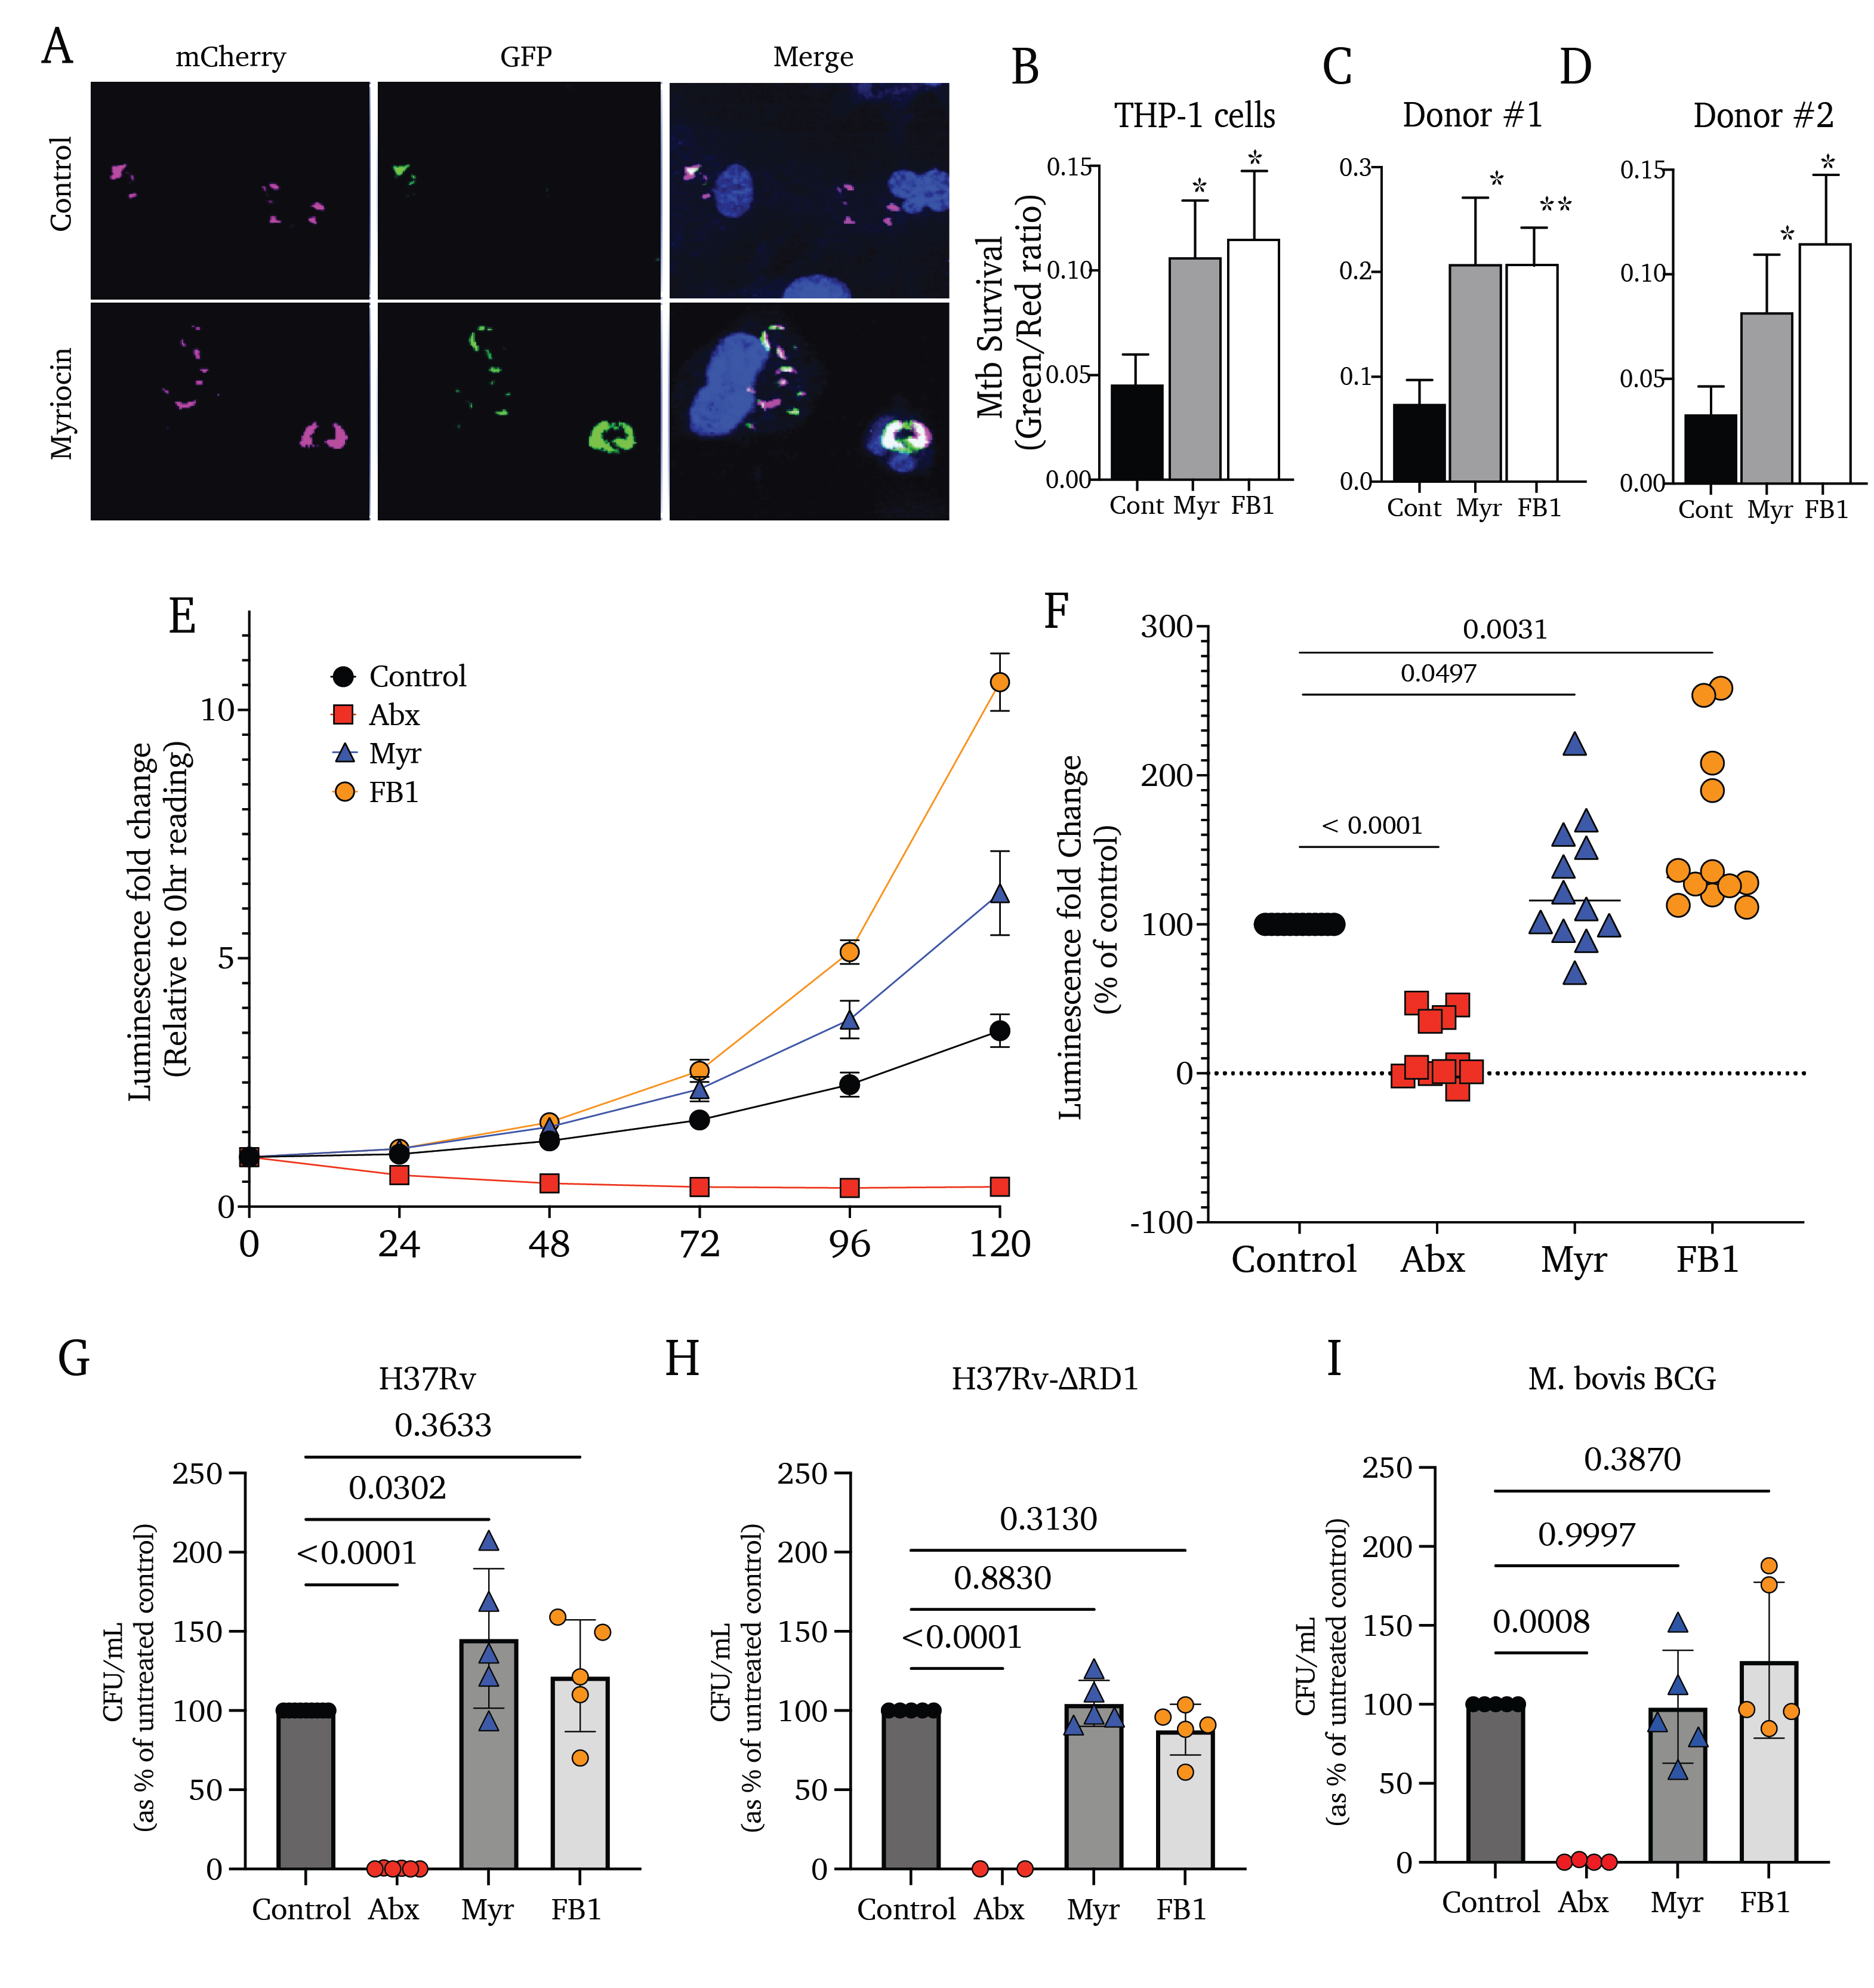
We finally sought to determine whether these findings are relevant to the success or severity of infection by asking the following question: does sphingolipid production influence the rate of intracellular replication for Mtb? To this end, we first utilized a live/dead fluorescent reporter strain of Mtb, which constitutively expresses mCherry and expresses GFP upon induction with doxycycline (H37Rv-Live/Dead)50,51. THP-1 monocyte-derived macrophages were infected with H37Rv-Live/Dead for 4 hours without sphingolipid inhibition. At that point, extracellular bacteria were removed, sphingolipid inhibitors were added, and cells were incubated for 72 hours and induced with doxycycline for 24 hours (96 hours of total infection time). Cells were then visualized using confocal fluorescence microscopy (Figure 4.4A). By quantifying the ratio of red to green signal as a proxy for intracellular Mtb survival, we find that THP-1 cells treated with Myr or FB1 harbor a 1-3-fold increase in metabolically active mycobacteria (Figure 4.4B). We observed similar increases in Mtb growth when treating two donor-derived peripheral blood monocytes with Myr and FB1 (Figure 4.4C and D).
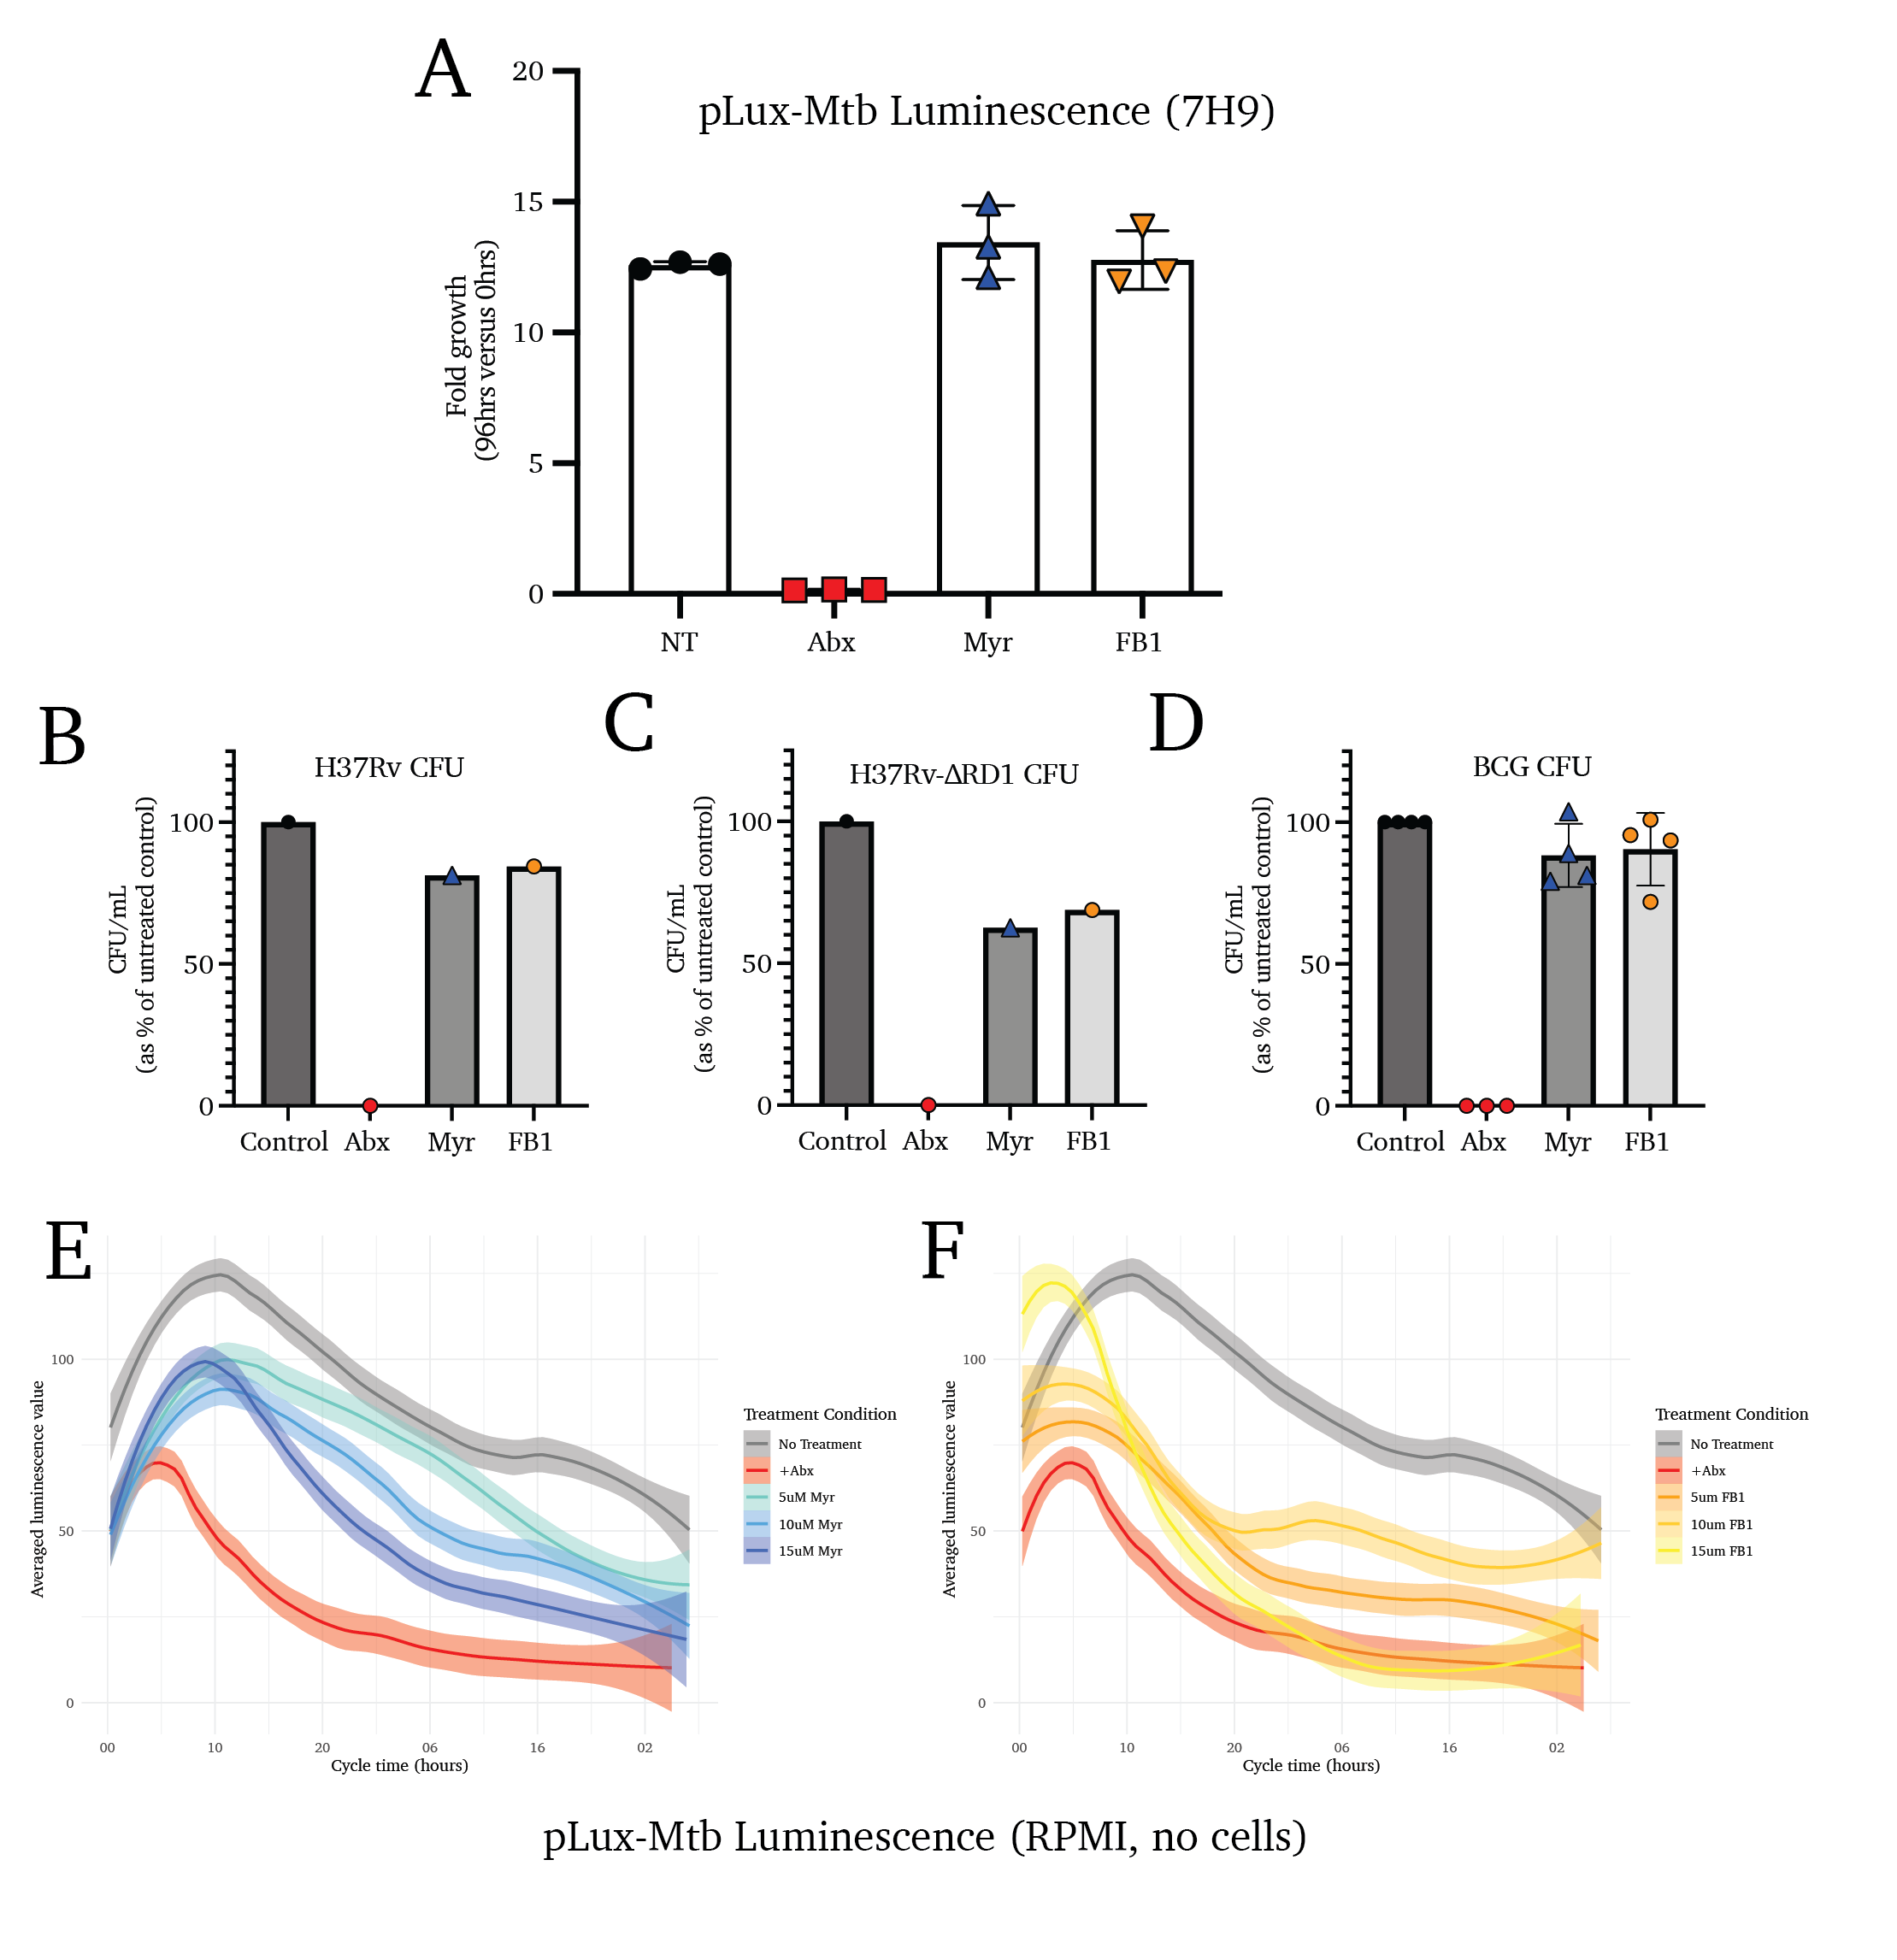
To validate and clarify these observations, we utilized a luminescent strain of Mtb (transformed with the pLux plasmid; H37Rv-pLux) to report the growth of the bacteria in host cells treated with sphingolipid biosynthesis inhibitors. One representative growth curve is shown, followed by the aggregated fold-growth of several biological replicates at 96 hours (Figure 4.4E and F). We observe a significant increase in overall mycobacterial replication in cells treated with sphingolipid biosynthesis inhibitors, supporting the hypothesis that sphingolipids are responsible for blocking Mtb replication, as opposed to mediating antimicrobial activity.
Together, these data suggest that Mtb metabolic activity is restricted in host cells with active sphingolipid biosynthetic pathways, signifying either an increase in replication rate or a decrease in antimicrobial activity by the host cell. The gold-standard methodology of quantifying all viable Mtb bacilli in the sphingolipid-depleted cells is quantifying colony-forming units extracted from infected cells. Using such an approach on cells infected using the same paradigm as above, we find that sphingolipid depletion increases the intracellular growth of Mtb strain H37Rv (Figure 4.4G).
The attenuated deletion mutant strain H37Rv-ΔRD1 lacks essential virulence factors, including the Type VII secretion system and the two immunodominant factors ESAT-6 and CFP-1052–56. When cells infected with H37Rv-ΔRD1 are treated with Myr and FB1, we find no change to the intracellular replication of the bacteria (Figure-Mtb-Replication H). Similarly, the mycobacteria vaccine M. bovis strain Bacillus Calmette-Guerin (M. bovis BCG) is highly attenuated, lacking many of the same virulence factors as the H37Rv-ΔRD1 strain (Figure 4.4I)55,57,58.
Notably, we show that Myr and FB1 treatment are mildly toxic to mycobacteria strains H37Rv-pLux, H37Rv, and M. bovis BCG using luminescence and colony forming unit assays (Figure S4.4A-F). These data support a hypothesis that these compounds indirectly result in the increased replication of the mycobacteria by inhibiting the antimicrobial activity of the host cell.
4.4 Discussion
Here we present the first investigation into the role of sphingolipids in the cellular response to Mtb-induced membrane damage. We find that inhibiting sphingolipid production in Mtb-infected cells results in an accelerated accumlation of damage in the Mtb-containing vacuole. In vitro analysis showed that inhibiting sphingolipid production induces a simultaneous increase in the sensitivity to membrane damage and a reduction in the rate of restored lysosomal homeostasis after damage. Though still preliminary, we observe no major difference in the recruitment of the ESCRT-III complex to damaged organelles. And, while the mechanism is yet unclear, we observe a significant accumulation of SM at the site of Mtb-induced membrane damage. Finally, in observing the rate of bacterial growth during SL inhibition, we find that SLs are essential in restricting intracellular Mtb growth.
4.4.1 Lipids in early membrane repair
At early time points (~30 minutes post-damage induction), membrane repair complexes such as ESCRT-III mediate the direct repair of a perforated membrane17. This process is highly dependent on the coordinated delivery of membrane lipids to the damaged organelle. In 2022, Tan and Finkel showed that the phosphatidylinositol-4-phosphate kinase PIK2A is essential in coordinating the formation membrane contact sites between the ER and a damaged lysosome, and for the resulting transfer of phosphatidylserine and cholesterol to restore lysosomal homeostasis19. These results were verified and expounded upon by Radulovic et al. 202220. Thus, it is known that the selective synthesis and delivery of lipids is essential for expeditious membrane repair.
In agreement with this, we observe that sphingomyelin accumulates at the sites of LLOME- and Mtb-induced membrane damage (Figure 4.3) throughout infection. These results do not clarify the source of this sphingomyelin: is our observed sphingomyelin produced locally or delivered pre-synthesized to the damaged membranes? The primary sphingomyelin synthase, SMS1, is a Golgi-resident membrane protein and is responsible for >80% of the total sphingomyelin production in the cell – inclusive of plasma membrane and endosomal sphingomyelin59–61; the secondary synthase, SMS2, primarily resides at the plasma membrane and produces no appreciable endosomal sphingomyelin59,61.
The rapidity of our observed sphingomyelin accumulation at sites of LLOME-induced membrane damage (<15 minutes, Figure 4.3A) may suggest a mechanism for delivery of pre-synthesized sphingomyelin, though this remains an open question.
4.4.2 Sphingolipid production restricts Mtb replication
Of significant note, we find that blocking sphingolipid results in a significant increase in the intracellular growth and survival of Mtb, highlighting the importance of this lipid class in enabling antimicrobial activity (Figure 4.4).
At later time points, or in instances of extensive membrane damage, the ESCRT machinery serves as a coordinator of autophagy-mediated degradation of the damaged organelle17,46. Intriguingly, we see that the relative increase in membrane damage among sphingolipid-inhibited cells (versus untreated control cells) at 24 hours of sphingolipid inhibition is gone by 96 hours – at which point both sphingolipid-producing and sphingolipid-inhibited cells experience large and approximately equivalent degrees of Mtb-induced membrane damage (Figure S4.2). Numerous reports have found that Mtb secretes inhibitors of host autophagy, including the enhancer of intracellular survival (Eis)3, and several proline-glutamic acid (PE) or proline-proline-glutamic acid (PPE) proteins such as PE_PGRS474 and PPE5162. We may thus hypothesize that Mtb-restriction of autophagy allows membrane damage to “catch up” in sphingolipid-replete cells at late time points. However, much work remains to characterize such an effect and whether sphingolipids also play a role in this process.
4.4.3 Conclusions
In this work, we show that sphingolipids are an essential component of the cell’s restriction of Mtb growth. This appears to be the product of sphingolipids’ role in enabling efficient membrane repair in response to pathogenic Mtb activity. Thus, leveraging the host sphingolipid metabolic network as a form of host-directed therapy may represent a novel route of antitubercular therapy.
4.5 Methods
4.5.1 Cell culturing and cell lines used
Wildtype THP-1 monocytes were sourced from American Type Culture Collection (ATCC TIB-202) and cultured in RPMI 1640 medium (Thermo Fisher Scientific, product #11875119) supplemented with 10% FBS (Seradigm), 1x Gibco Penicillin-Streptomycin (Thermo Fischer Scientific, product #15-140-163), and 1x Gibco Non-Essential Amino Acids (Thermo Fischer Scientific, product #11140050). Before experimental use, THP-1 cells were activated for 48 hours via treatment with 50nM phorbol 12-myristate 13-acetate (PMA; Sigma-Aldrich, product P8139-1MG). Donor peripheral blood monocytes were collected via blood draw and cultured in GM-CSF before plating on glass coverslips. All cell counting was done using a hemocytometer with trypan blue (Gibco) counterstain. Wildtype RAW 264.7 macrophages were sourced from the American Type Culture Collection (ATCC TIB-71). Sptlc2-/- RAW 264.7 macrophage line was cloned as reported in our prior report, Niekamp et al. 202141. Sgms1/2-/- RAW 264.7 macrophages were cloned as reported in Niekamp et al. 202223 and kindly provided by Dr. Joost Holthuis of Osnabrück University. All RAW 264.7 lines were routinely cultured in were cultured in Dulbecco’s modified Eagle medium (DMEM; Thermo Fisher Scientific, product #11965118) supplemented with 10% FBS (Seradigm), 1x Gibco Penicillin-Streptomycin (Thermo Fischer Scientific, product #15-140-163), and 1x Gibco Non-Essential Amino Acids (Thermo Fischer Scientific, product #11140050), trypsinized using 0.25% trypsin solution (Gibco) and counted using a hemocytometer and trypan blue solution (Gibco) as a counterstain.
All experiments’ biological replicates represent cells plated, infected, and collected on separate days.
4.5.2 Plasmids and small molecule inhibitors
The mAG-Gal3 construct was initially produced in the laboratory of Dr. Niels Geijsen at KNAW-Hubrecht Institute in Utrecht, the Netherlands44; this plasmid was purchased from AddGene (Product #62734). The BFP-Galectin 3 plasmid was assembled using ligation of human Galectin 3 isolated from the mAG-Gal3 plasmid and EBFP2 from the plasmid EBFP2-N1 (AddGene product #182100). Restriction site extension PCR63 yielded the insertion of a NheI cut site to the C-terminus of EBFP2 from the EBFP2-N1 plasmid (primer: gatcttGCTAGCcttgtacagctcgtccatgcc; capital letters denote NheI cut site) and to the N-terminus of Galectin 3 from the mAG-Gal3 plasmid (primer: atcgatGCTAGCggaggaggaggatctgcagac; capital letters denote NheI cut site). Following ligation of BFP insert with Gal3 plasmid, individual clones were isolated and sequenced for verification of desired insertion.
Recombinant Lysenin-GFP protein was expressed in E. coli BL21 transformed with the pET28/His6-EGFP-NT-Lys plasmid. Bacteria was grown in LB supplemented with 10 mM MgSO4 and 0.02% Maltose. Bacterial pellets were lysed using sonication, and protein was purified from the supernatant using Ni-NTA resin.
Myriocin and FB1 stock solutions were made at 5 mM in DMSO. Working stocks were diluted in cell or bacterial culture media and added to cells at the denoted final concentrations. Antitubercular antibiotics rifampicin and isoniazid were used at 1 ng/mL and 0.4 ng/mL, respectively.
4.5.3 Cytotoxicity screening
Cytotoxicity of Myr and FB1 was assessed using resazurin, a compound converted into fluorescent resorufin via active oxidative metabolism63. A resazurin sodium (TCI Chemicals; product #R0203-1G) stock solution was prepared at 0.5 mg/mL in DMSO and added to cells at a final 0.15 mg/mL concentration. Cells were incubated at 37 °C for 4 hours. Fluorescence intensity was measured using a CLARIOstar (BMG Labtech) plate reader with the 560 nm excitation/590 nm emission setting.
4.5.4 Thin-layer chromatography
THP-1 and RAW 264.7 cells were cultured and treated with small molecule inhibitors for three days as above. Cells were additionally treated with either NBD-sphinganine (Avanti Polar Lipids, product #810205X-250ug), C6-NBD-ceramide (Avanti Polar Lipids, product #810209X-1mg), or radio-labeled serine for 1 hour at 37 °C in cell culture media. The cells were then washed 3x with PBS and scraped into 1 mL ice-cold PBS 2x. Lipids were extracted via the addition of 2:1 chloroform:methanol (vol:vol) and 30-second vigorous mixing. The biphasic solution was separated via 1-hour incubation at -20 °C and 10 min spin at 2,000 xg in a chilled centrifuge. The lower organic layer was carefully removed with a glass pipette and dried under the flow of nitrogen gas. Extracted lipids were resuspended in 10 μL chloroform and streaked onto the origin of a silica plate. Lipids were separated on the plate using a chromatography mobile phase consisting of 65:25:1 chloroform:methanol:ammonium hydroxide (vol:vol:vol). NBD-lipids were visualized using the 488 nm filter on a Sapphire FL (Azure Biosystems) biomolecular imager. Radio-labeled serine-containing lipids were visualized using a phosphor imaging plate. Quantification of lipid bands in each lane was achieved using the Fiji gel analysis tool.
4.5.5 Microscopy staining
All antibody-stained microscopy samples were treated as follows: 1-hour fixation in 4 % formaldehyde in PBS, 1-hour permeabilization/blocking in 0.1 % saponin and 5% normal goat serum in PBS, overnight primary stain with the denoted antibodies at the denoted dilutions in antibody staining buffer (0.1 % saponin and 5% bovine serum albumin in PBS), 3x washes with perm/block buffer, 2-hour secondary stain at room temperature with appropriate secondary antibody, 3x washes in perm/block buffer, 10-minute stain with 1x DAPI and 1x phalloidin where denoted. Coverslips were mounted to glass slides using ProLong Glass antifade mountant (Thermo Fisher, #P36980).
Antibodies: anti-EEA1 (Cell Signaling Technologies, Rabbit mAb Clone C45B10, product #3288); anti-Rab7 (Cell Signaling Technologies, Mouse mAb Clone E9O7E, product #95746); anti-LAMP1 antibody (Cell Signaling Technologies, rabbit mAb clone D2D11, product #9091S); anti-Galectin 3 (Thermo Fisher, Mouse mAb clone A3A12, product #MA1-940); anti-Rabbit secondary (Invitrogen, Goat mAb, product #A-11034 (Alexa-488) and #A-32722 (Alexa-647)); anti-Mouse secondary (Invitrogen, Goat mAb, product #A-11001 (Alexa-488) and #A-32728 (Alexa-647)). Where denoted, microscopy samples stained with Lysotracker Red DND-99 and Cellmask Deep Red were stained for 15 minutes at 1:10,000 and 1:20,000 dilutions in PBS, respectively, before fixation.
4.5.6 Mtb culturing and THP-1 infection
All Mycobacterium tuberculosis infections were performed in a dedicated biosafety level 3 facility according to approved safety guidelines.
Historical Mtb strain H37Rv and the attenuated RD1-deletion mutant strain H37Rv-ΔRD1 were gifts kindly given to us by Dr. David Lewinsohn at the Oregon Health & Science University and the Portland Veterans Affairs Medical Center; H37Rv-ΔRD1 was originally produced by the lab of Dr. Sherman55. The vaccine strain Mycobacterium bovis Bacillus Calmette-Guerin was sourced from the lab of Dr. Melanie Harriff at the Oregon Health & Science University and the Portland Veterans Affairs Medical Center. The luminescent H37Rv-pLux strain was a gift kindly provided to us by Dr. Bryan Branson at the Massachusetts Institute of Technology and was kept under antibiotic selection using Zeocin® (InvivoGen). The H37Rv-Live/Dead strain was provided from the lab of Dr. Sarah Fortune at the TH Chan School of Public Health, Harvard University, and was kept under antibiotic selection with Kanamycin50. The H37Rv-dsRed strain was kindly provided to us by the lab of Dr. Dave Lewinsohn at the Oregon Health & Science University and Portland Veterans Affairs Medical Center.
All Mtb strains were cultured at 37 °C in Difco™ Middlebrook 7H9 (Becton Dickinson, product #271310) broth medium supplemented with 10 % Difco™ Middlebrook oleic acid-albumin-dextrose-catalase enrichment (OADC; Beckton Dickinson, product #L12240), 0.2 % glycerol, and 0.05 % Tween-80 (Thermo Fisher Scientific, product #BP337-500), and carefully maintained between 600 nm optical density (OD600) of 0.1 and 1.5 for up to 4 weeks before fresh frozen stocks were thawed. Infections were timed such that the OD600 fell between 0.5 and 1.0 at the time of collection. Before infection, cultures were collected and pelleted at 2000 xg for 5 minutes, washed 1x with PBS, and pelleted again. The bacterial pellet was resuspended in 1 mL antibiotic-free RPMI media (supplemented as described above otherwise), and a single-cell suspension was achieved by repeated passage through a blunt-tipped 18-gauge needle 25 x and filtration through a 5 μm filter (to remove any remaining clumps of bacteria). The OD600 of the single cell suspension was measured, and the concentration of bacteria was estimated from a modified McFarland standard of 1.0OD600 = 2.5 x 10⁵ CFU/mL.
The bacterial suspension was diluted to prepare the denoted multiplicities of infection (MOI) in low volumes, depending on the plate surface area. For a 96-well plate, infections were performed in a volume of 50 μL; for a 24-well plate, infections were performed in 300 μL; for a 6-well plate, infections were performed in 1 mL. All infections were halted by the addition of 4% formaldehyde in PBS, in accordance with biosafety level 3 protocol.
4.5.7 Mtb membrane damage assay and quantification
We found that the mAG-Gal3 damage reporter was ideal for super-resolution microscopy, but that variation in fluorescence signal between cells impaired quantification of high-content imaging; the BFP-Gal3 fluorescent fusion protein was more uniformly expressed between individual cells and was used as the membrane damage reporter in all reported high-content imaging quantification. For both representative images and quantification, 1 x 10⁵ THP-1 (BFP-Galectin 3-expressing, or mAG-Galectin 3-expressing, as denoted) cells were plated and activated for 48 hours with 50 nM PMA on 20 mm coverslips in a 24-well plate. Cells were infected at an MOI of 10 as above for four hours, and extracellular bacteria were removed after 4 hours of uptake. Cells were then incubated with Myr or FB1 for 24-, 48-, and 96-hours post-infection start. Coverslips were then rinsed 2x with PBS and fixed for 1 hour in 4% formaldehyde. For representative images, cells were stained with DAPI and imaged on a Zeiss LSM 900 confocal microscope using AiryScan super-resolution and a 63x oil-immersion objective. Representative images are presented as maximum-intensity z-projections. For high-content images used in quantification, cells were stained with DAPI and DylightTM 488 Phalloidin (Cell Signaling Technology #12935S) and imaged using a 40x oil-immersion objective (NIKON CFI S FLUOR 40X OIL OBJECTIVE) on a Keyence BZ-X fluorescence microscope using multi-section image stitching (processed using the Keyence BZX Analyzer software).
Quantification was achieved by manual counting of at least 200 cells per image per biological replicate using FIJI. Cells were categorized cells by the presence or absence of BFP-Galectin 3 puncta colocalized with H37Rv-dsRed. Image filenames were blinded to the counter and de-blinded after quantification of the entirety of each biological replicate.
4.5.8 LLOME Membrane damage repair assay
1 x 10⁵ THP-1 cells were plated in chamber slides (Ibidi) and activated for 48 hours in 50 nM PMA. Cells were treated with 1 mM LLOME for 15 minutes before being washed out and replaced with RPMI for the denoted recovery times. Cells were stained for 15min with Lysotracker Red DND-99 (1:20,000; Invitrogen, product #L7528) to visualize acidified lysosomes and CellMask Deep Red (1:20,000; Invitrogen, product #C10046) for counterstain. Total treatment or recovery time includes 15-minute stains (e.g., No Recovery samples were concurrently stained and treated with LLOME, and 120-minute Recovery samples were stained for 15 minutes at 105 minutes post-washout). For cells treated with Myr or FB1, recovery occurred in the presence of these inhibitors.
Imaging was performed immediately after staining on a Keyence BZ-X100 fluorescence microscope using a 40x oil-immersion objective (NIKON CFI S FLUOR 40X OIL OBJECTIVE). 3x3 or 5x5 tiled images were stitched using the Keyence Image Analysis software. Images were analyzed using the Cell Extraction tool in the Keyence Image Analysis software. Extraction conditions (i.e., thresholds for the CellMask and Lysotracker Red channels) were set using a “No LLOME” image and applied to each subsequent image automatically. The total cell area was defined using the CellMask signal, and we report the mean area of the Lysotracker signal above the threshold as a percentage of the total cell area for at least 200 cells per treatment condition and timepoint for each biological replicate. The mean lysotracker signal for cells of each treatment/genotype group was normalized to the mean percentage for each biological replicate to correct for differences in overall signal between replicates; at least three biological replicates were measured for each timepoint and cell type. Data visualization was achieved using the ggplot2 package in R; statistical testing was achieved via unpaired t-test against the untreated control (THP-1 cells) or wildtype control (RAW 264.7 cells) using GraphPad Prism.
4.5.9 ESCRT recruitment assay
1 x 10⁵ THP-1 cells were activated and plated on 20 mm coverslips as above, and pretreated with either vehicle control (0.1 % DMSO) or Myr or FB1. Cells were then treated with the agent LLOME in order to induce lysosome-targeted damage. Cells were then stained for the late endosome/lysosome marker Rab7 and the ESCRT III complex member CHMP4b as described above in {#sec-MtbDamage-Methods-MicroscopyStaining}. Cells were then imaged using a Zeiss LSM 900 confocal microscope using AiryScan super-resolution and a 63x oil-immersion objective. Quantification was achieved using the Manders colocalization test in FIJI.
4.5.10 Lysenin-GFP colocalization assays
For colocalization of Lysenin-GFP with BFP-Galectin 3 membrane damage reporter, cells were plated and activated as above on 20 mm glass coverslips. Cells were transfected with BFP-Galectin 3 plasmid for 48 hours using Lipofectamine 3000 transfection reagent (Thermo Fisher Scientific, #L3000075). Cells were treated with 100 uM LLOME in PBS for 30 minutes prior to fixation in 4% formaldehyde. Cells were permeabilized using 0.1% saponin and stained with purified Lysenin-GFP. Cells were imaged on a Nikon Spinning Disk confocal microscope (Nikon Yokogawa CSU-W1 Series Spinning Disk). Mander’s correlation coefficients of Green∷Red signal were quantified using FIJI. Statistical testing was achieved using an unpaired t-test.
For colocalization of Lysenin-GFP with Mtb, THP-1 cells were plated and activated as described above on 20 mm glass coverslips. Cells were infected with H37Rv-dsRed at an MOI of 10 as above for 24, 48, 72, and 96 hours before fixation. Cells were permeabilized using 0.1% Saponin and stained with purified Lysenin-GFP. Cells were imaged on a Zeiss LSM700 confocal microscope, and Pearson’s correlation coefficients of Green∷Red signal were quantified using FIJI. Statistical testing was achieved using an unpaired t-test performed in GraphPad Prism.
4.5.11 Live/Dead reporter-based mycobacterium growth assay
THP-1 cells were plated and activated as described above on 20 mm glass coverslips. Cells were infected at an MOI of 10 as above for 4 hours before the removal of extracellular bacteria via PBS wash. Myr and FB1 were added, and cells were incubated for 72 hours. At 72 hours post-infection, cell media was refreshed with doxycycline additive for another 24 hours. Coverslips were fixed and stained with DAPI before imaging using a NIKON Spinning Disk confocal microscope (Nikon Yokogawa CSU-W1 Series Spinning Disk). The ratio of live:dead bacteria was quantified by thresholding the green and red channels and quantifying the number of green-and-red pixels versus the number of red-only pixels. Depicted are the means of three independent biological replicates for THP-1 cells and PBMCs from two donors. Statistical testing was achieved via an unpaired t-test performed in GraphPad Prism.
4.5.12 Luminescence-based mycobacterium growth assay
THP-1 cells were plated and activated as described above in white-walled 96-well plates (ThermoFisher, product #165306). Cells were infected with H37Rv-pLux at an MOI of 5 in 50 μL for 4 hours at 37 °C, followed by 2x PBS washes and the addition of inhibitor in a final volume of 200 μL. Plates were sealed with an optically clear gas-permeable plate seal (Breathe-Easy, Sigma Aldrich, product #Z380059) to limit evaporation. The infected cells were incubated at 37 °C for 120 hours. On each 24-hour interval, the plates were equilibrated for 45 minutes in a pre-warmed luminescence plate reader (FLUOstar Omega, BMG Labtech) to limit condensation. Luminescence values were collected using the top optic and a well scan under the spiral average setting (diameter 5 mm). Final data are reported as the average fold-change in luminescence for technical replicates after background subtraction and normalization (each well was normalized to its starting value). Statistical testing was achieved via an unpaired t-test.
For luminescence growth assays of H37Rv-pLux alone, bacteria were cultured in 7H9 liquid culture media supplemented with the denoted compounds and incubated in a 96-well plate inside a luminescence plate reader (FLUOstar Omega, BMG Labtech) for 120 hours. Luminescence data was collected every 15 minutes using the same acquisition settings as above.
4.5.13 CFU-based mycobacterium growth assay
THP-1 cells were activated for 48 hours with 50 nM PMA. Cells were infected as above at an MOI of 10 in 1 mL for 4 hours at 37 °C in the absence of sphingolipid inhibitors. After infection incubation, cells were washed 2x with PBS and fed with media containing vehicle control (DMSO at 0.3 % final vol:vol), 15 μM Myr, 5 μM FB1, or 1 ng/mL rifampicin and 0.4 ng/mL isoniazid. Infected cells were incubated with inhibitors for 96 hours before being gently washed 2x with PBS and lysed via incubation in PBS with 0.1 % Triton X-100 for 10 min at 37 °C and vigorous pipetting. Lysates were serially diluted to 1:20, 1:200, and 1:2000. 100 μL of diluted lysates were streaked on 7H10 agar plates and incubated at 37 °C for 3-5 weeks. At the end of this incubation period, streaked 7H10 agar plates were counted to determine CFU/mL.
For CFU assays on mycobacteria in culture (non-infection CFU assays, as in Figure S4.4 B, C, and D), incubation with the denoted inhibitors was performed in liquid 7H9 culturing media for 96 hours. Bacterial cultures were serially diluted to 1:100, 1:10,000, and 1:1,000,000 and streaked on 7H10 agar plates as above. After 3-5 weeks of incubation at 37 °C, streaked plates were counted to determine CFU/mL.
4.6 Contributions and Acknowledgements
GG designed the study, performed the majority of the work, and wrote the manuscript. AG performed LLOME-induced Lysenin-GFP accumulation experiments, ESCRT localization experiments, and assisted with writing and editing. MTG performed NBD-ceramide and NBD-Sphingosine TLCs, assisted with cell culturing, and edited the manuscript. Aidan Anastas purified Lysenin-GFP for LLOME-induced Lysenin-GFP localization experiments and edited the manuscript. HL performed Mtb-Lysenin-GFP colocalization experiments. FGT oversaw and directed the study, performed the radiographic TLC, and edited the manuscript.
We thank Dr. Joost Holthuis for providing cell lines and intellectual input. We thank Dr. Tim Bates for his help in cloning the BFP-Galectin 3 plasmid. We thank Dr. David Lewinsohn, Dr. Melanie Harriff, Dr. Bryan Bryson, and Dr. Sarah Fortune for providing Mtb strains used in this study. We thank Dr. Eric Barklis and Dr. Sascha Kuhn for their assistance in purifying Lysenin-GFP. We thank the OHSU Advanced Light Microscopy Core for significant assistance in image capture and analysis. We also thank Dr. Stephanie Kaech Petrie, Dr. Hannah Borstein, and Dr. Felice Kelly of the OHSU Advanced Light Microscopy Core facility for their image acquisition and analysis expertise. Finally, we thank Madeleine Faucher for her patience and assistance in preparing and editing this manuscript.
We have no conflicts of interest to declare.
4.7 Supplemental data